> For the complete documentation index, see [llms.txt](https://docs.timeinpixels.com/llms.txt). Markdown versions of documentation pages are available by appending `.md` to page URLs; this page is available as [Markdown](https://docs.timeinpixels.com/nobe-omniscope/qc/qc-timeline.md).
# QC Timeline
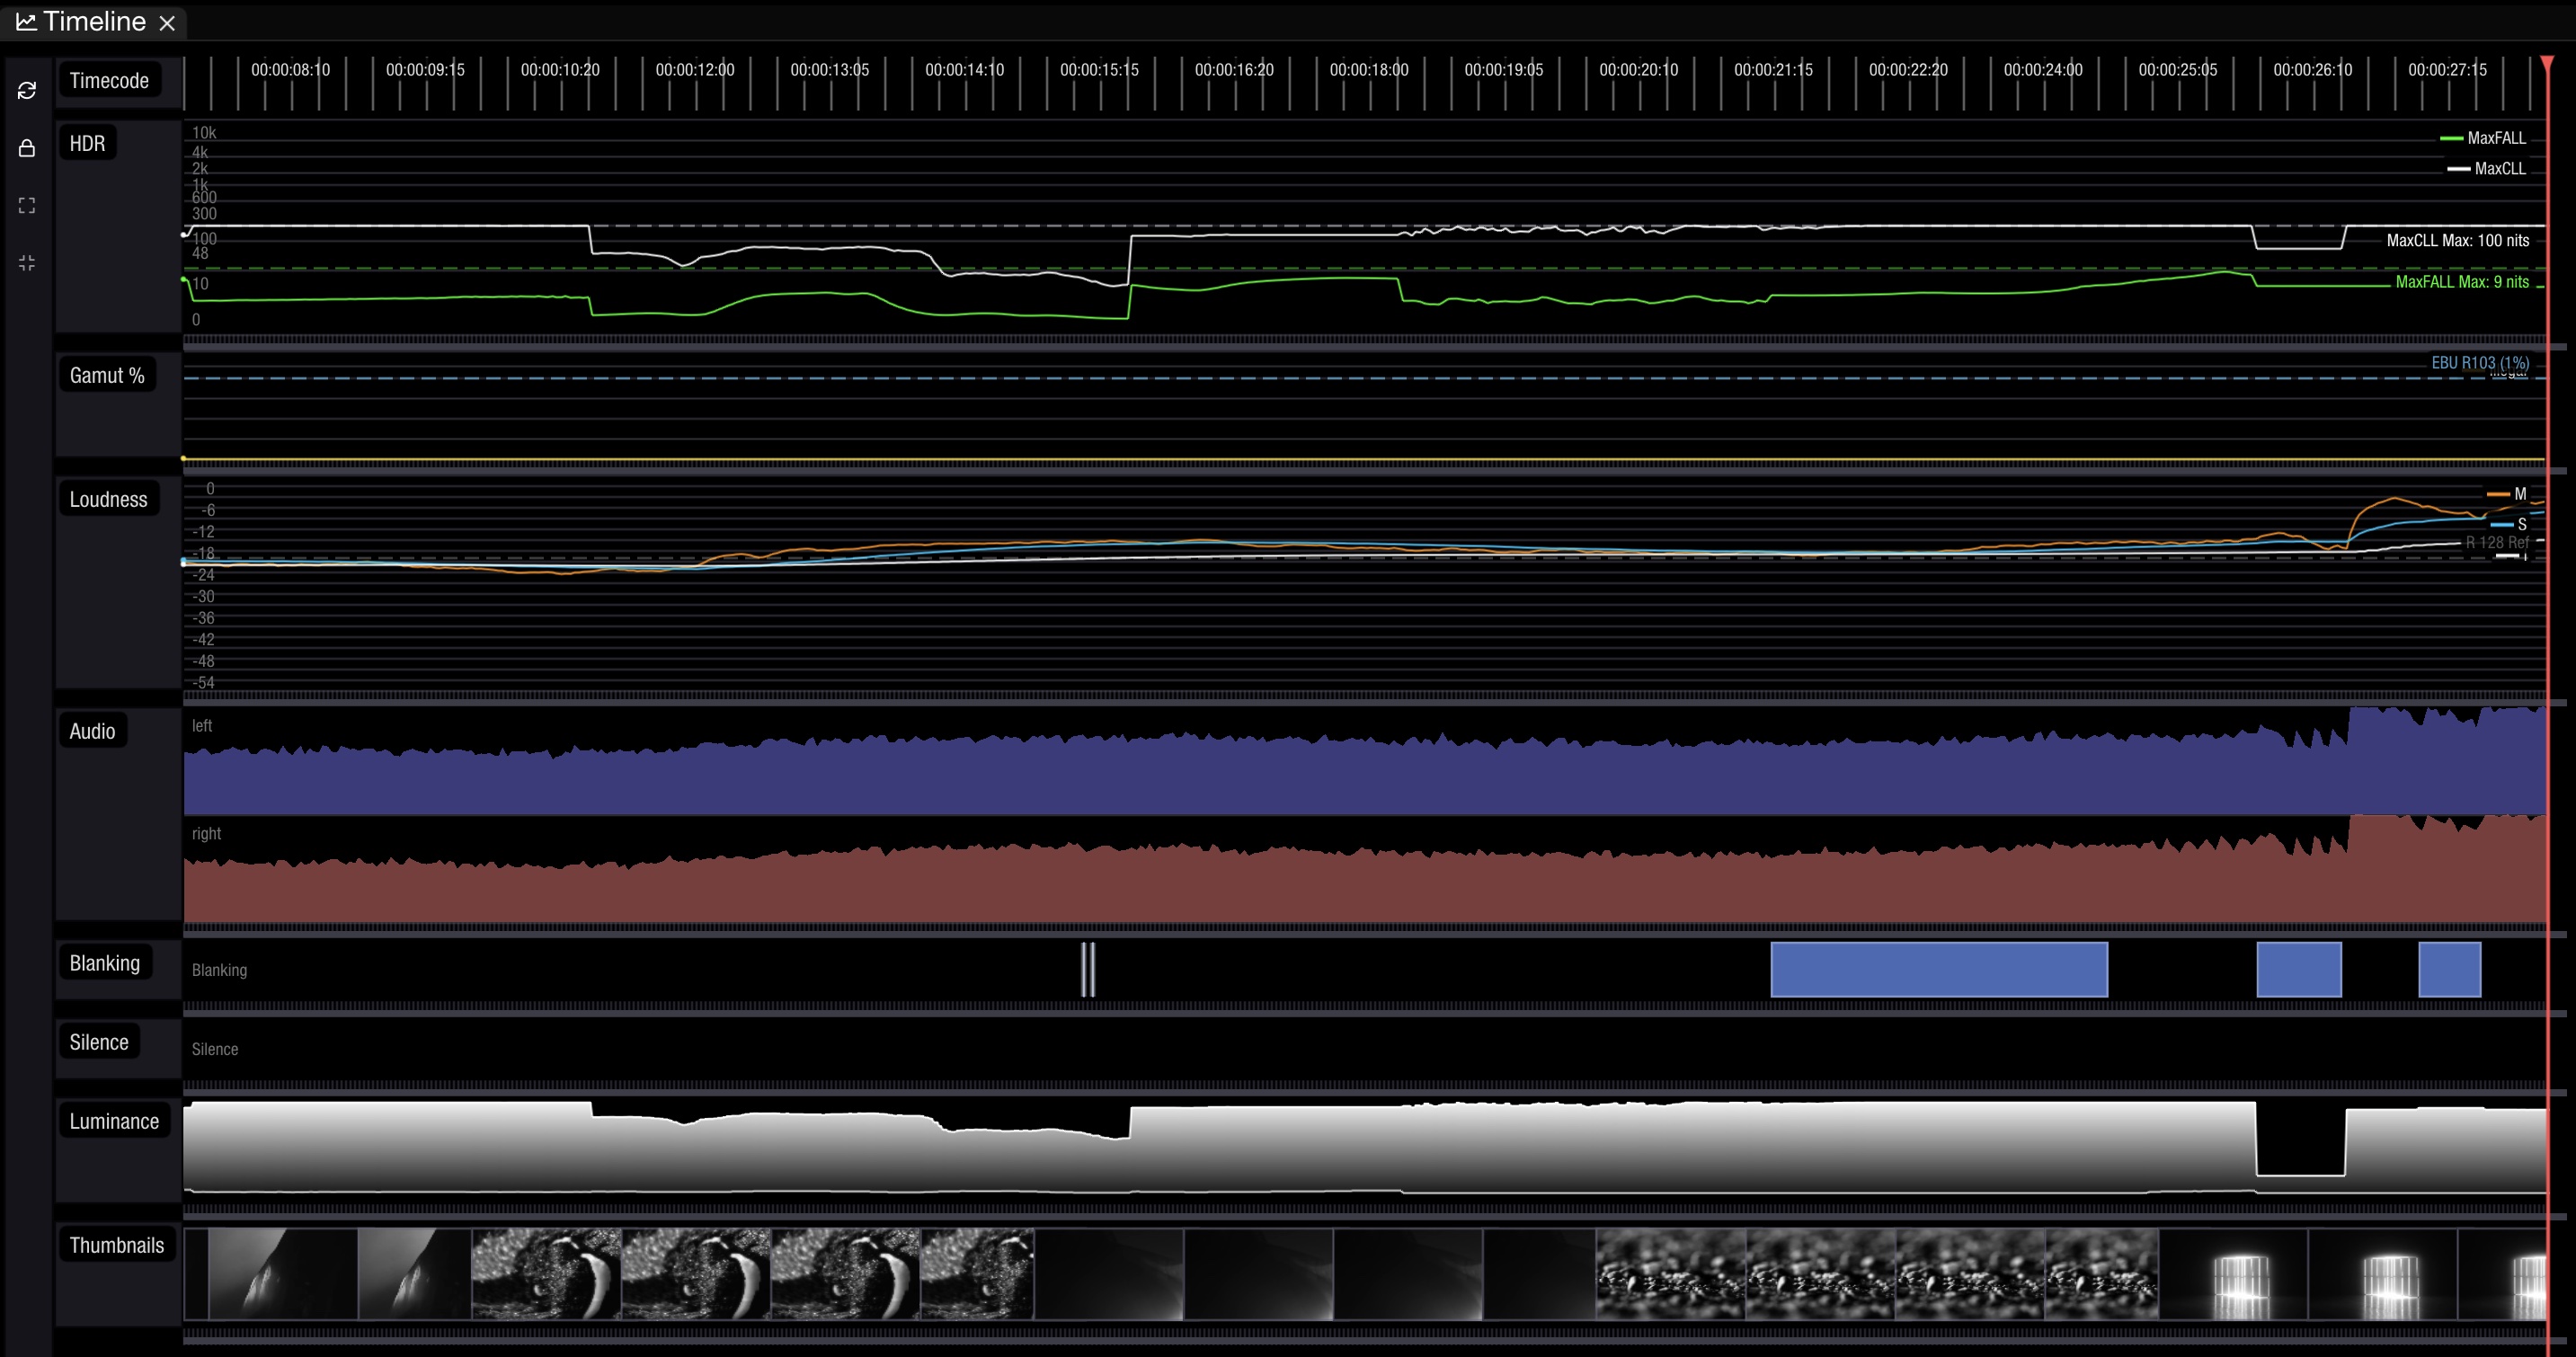
QC Timeline feature
QC Timeline V2 (available since 1.11.25) replaces the earlier timeline with improved rendering and clarity. V2 keeps the same track-based workflow but is faster to render and clearer at high density.
OmniScope features a very useful QC tool called QC Timeline. It can be toggled in the QC top menu and allows you to see all the QC events as well as audio waveform, HDR stats, thumbnails and many more.
QC Timeline with multiple tracks
The timeline is built in realtime based on incoming frames and uses timecode to reference events. This means you can monitor your SDI signal as it comes in and will follow your playhead in real-time while you move around your timeline.
The timeline can display tracks for HDR statistics, gamut percentage, black-frame percentage, audio loudness, audio waveforms, blanking, luminance, thumbnails, and PSE events. **Video Events** groups HDR gamut, black-frame, and dead-pixel detections into labeled lanes (depending on your license). Silence periods are shaded directly on the **Audio** waveform track.
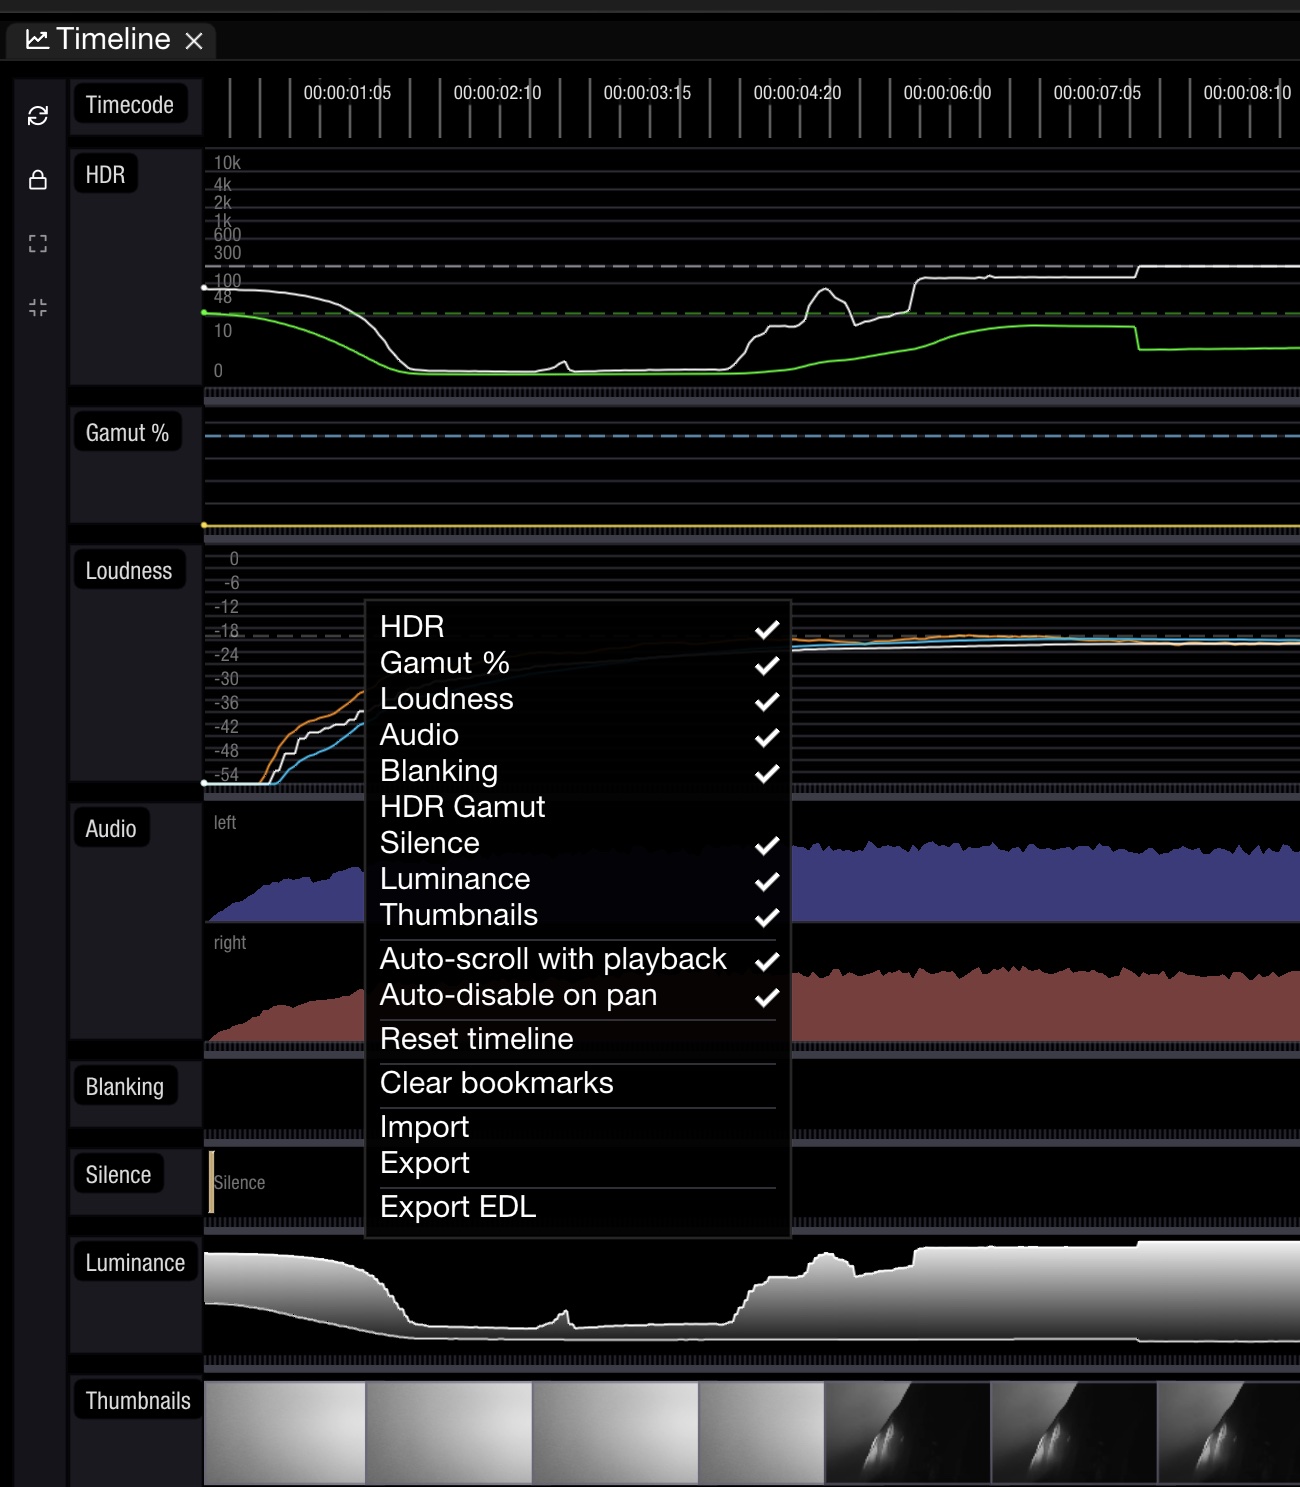
Each track can be toggled on and off in the right click context menu:
QC Timeline context menu with track toggles
When **View → Classic Look** is off, tracks backed by a QC analysis tool also show the tool state in the header. A filled dot means analysis is running; a hollow dot means it is stopped. Click the dot to start or stop that tool, or hover over the header and open the **…** menu to change the state or jump to its settings in the QC panel. A stopped tool collapses to a thin, empty lane so previously recorded values are not mistaken for current analysis. Display-only tracks do not have this control.
You can also change the size of each track by dragging & dropping the top/bottom edges of the tracks. You can also re-arrange the tracks by dragging & dropping the track headers on the left side.
## Scrolling and Zooming
Starting with version 1.11.55, use the mouse wheel over the timeline plot to navigate:
| Input | Action |
| -------------------------------------------- | --------------------------------------- |
| Mouse wheel | Scroll vertically through tracks |
| Shift + mouse wheel | Scroll horizontally through time |
| Option (macOS) / Alt (Windows) + mouse wheel | Zoom in or out around the mouse pointer |
Move the pointer to the time you want to inspect before zooming. Scrolling stops at the timeline's bounds.
On macOS, two-finger trackpad scrolling pans the timeline horizontally and vertically, and pinching zooms around the gesture position.
The timeline toolbar also provides buttons to zoom out and show the full timeline, or reset to the default zoom centered on the playhead.
## Pause QC recording for review
In the 1.11.65 beta and later, use the pause/play button in the Timeline toolbar or the matching button in each **QC Status** input header to pause or resume QC recording for that input. Pausing keeps the existing graphs available while you scrub the timeline; the picture and live meters continue updating. Resuming keeps the recorded graphs and restarts temporal analysis from the current frame. The same action is available in QC Settings.
## Using Free Run for Quick QC Scans
When working with video files, enable **Free run** mode with the rabbit button in the timeline toolbar or from the source's **Settings** tab. This processes frames as fast as possible, without waiting for real-time playback. The QC Timeline will be built at accelerated speed, allowing you to scan an entire file in a fraction of the normal playback time. See [Video File — Free Run Mode](https://docs.timeinpixels.com/nobe-omniscope/sources/video-file.md#free-run-mode) for setup details.
The context menu allows you to reset the timeline (start building it from scratch), clear the bookmarks (you can add them through Stream Deck action or cmd/ctr+B key shortcut), import and export the timeline to file (for further quick access) as well as [exporting the QC events as markers via EDL](https://docs.timeinpixels.com/nobe-omniscope/qc/qc-edl-export.md).
In OmniScope 1.11.54 and later, the context menu also includes **Send to Secondary Window**. Each input's timeline can be placed independently, and its assigned window is saved in layouts.
Also in 1.11.54 and later, thumbnail history remains visible when file playback loops or the playhead moves backward. Resetting the timeline starts a clean thumbnail history. Luminance-track Min/Max tooltips identify their values as **code values**, not nits; tracks that measure actual HDR luminance continue to use nits.