# Documentation


# Web Store

How to use our Web Store

### How to apply coupon code

In order to apply a coupon code and receive a discount please make sure to click "Add discount" link in the first checkout pop-up:

<figure><img src="https://565437294-files.gitbook.io/~/files/v0/b/gitbook-x-prod.appspot.com/o/spaces%2F-MFqn5MuayPgQPMZ9pwf%2Fuploads%2FrvOuXcrAv7EHy0nYpeMy%2FCleanShot%202023-10-31%20at%2008.08.29%402x.png?alt=media&amp;token=45270d59-6579-45a4-a21c-1cc026c301e1" alt=""><figcaption></figcaption></figure>

Once you enter the code and hit Apply button, the pricing shold update accordingly:

<figure><img src="https://565437294-files.gitbook.io/~/files/v0/b/gitbook-x-prod.appspot.com/o/spaces%2F-MFqn5MuayPgQPMZ9pwf%2Fuploads%2FO7J3eFw77FgTnnIoviqN%2FCleanShot%202023-10-31%20at%2008.08.53%402x.png?alt=media&amp;token=acee9fa5-f3be-41e8-8878-912157efdfdc" alt=""><figcaption></figcaption></figure>

### How to enter a company EU VAT ID

Once you provide an email address and press continue, you will be able to enter your EU VAT ID as well as all the company details that will be present in the invoice:

<figure><img src="https://565437294-files.gitbook.io/~/files/v0/b/gitbook-x-prod.appspot.com/o/spaces%2F-MFqn5MuayPgQPMZ9pwf%2Fuploads%2FLy1paoFyh5Dqez1XbN97%2FCleanShot%202023-11-23%20at%2010.16.36%402x.png?alt=media&amp;token=d8f1843e-b87a-49f3-a833-91d99ffb2128" alt=""><figcaption></figcaption></figure>


# FAQ

Frequently Asked Questions

## What is Nobe OmniScope?

Nobe OmniScope is a GPU based software scope application for Windows and macOS.\
It can monitor the following sources:

* [BlackMagic Design DeckLink and UltraStudio](/nobe-omniscope/sources/decklink-and-ultrastudio)
* [AJA capture cards](/nobe-omniscope/sources/aja)
* [NDI network streams](/nobe-omniscope/sources/ndi-r)
* [DaVinci Resolve through OFX plugin](/nobe-omniscope/sources/davinci-resolve-ofx)
* [Assimilate Scratch (via SDI plugin)](/nobe-omniscope/sources/assimilate-scratch)
* [Premiere Pro and After Effects through Transmitter plugin](/nobe-omniscope/sources/premiere-pro-and-after-effects)
* [Final Cut Pro X via Syphon](/nobe-omniscope/sources/final-cut-pro-x)
* [SRT streams](/nobe-omniscope/sources/srt-stream)
* [System video driver based sources (AJA U-Tap, etc)](/nobe-omniscope/sources/system-video-input)
* [Monitor anything on your desktop using Screen Capture](/nobe-omniscope/sources/screen-capture)
* [Image file source](/nobe-omniscope/sources/image-file)
* [Video file source](/nobe-omniscope/sources/video-file)

![](https://565437294-files.gitbook.io/~/files/v0/b/gitbook-legacy-files/o/assets%2F-MFqn5MuayPgQPMZ9pwf%2F-MGPzIXcuW3SLalRBeJp%2F-MGPzPvaLccv6MBrWKUD%2Fimage.png?alt=media\&token=f6526259-2bf8-437a-8349-dc802a9f0c69)

## How long does my Nobe OmniScope license last?

The license itself is **perpetual** and has no expiration date — you can keep using the application forever. What renews annually is the **Upgrade & Support Plan**, which includes one year of updates and priority support from your date of purchase. See [Upgrade & Support Plan](/nobe-omniscope/license/upgrade-and-support-plan).

## What happens if I don't renew my plan?

You keep the version of OmniScope you had when the plan expired and can use it indefinitely. You won't receive updates or priority support until you renew, and you can't install versions released after your expiry date. Skipping a year is fine — there is no penalty when you renew later.

You can disable auto-update to prevent the app from installing a newer build that your plan doesn't cover. See [Auto-updater](/nobe-omniscope/settings-and-preferences/auto-updater).

## I didn't receive my license key after purchase — what now?

The license key is sent in a separate email from the purchase receipt (the receipt comes from `paddle.com`, the license email comes from `timeinpixels.com`).

1. Check your spam / junk folder — this resolves most cases.
2. If it's not there, visit [timeinpixels.com/lost-license](https://timeinpixels.com/lost-license/) and enter the email used at checkout to have the license re-sent.
3. If no license is found, the checkout email may contain a typo — contact support with your approximate purchase date, product, payment method, and charged amount so the order can be looked up.

## My activation fails with "License not found", "Signature check failed", or an SSL error

When the standard email + license key activation fails, use the **Activation Code** method instead. It validates locally and bypasses the network path that firewalls, antivirus, SSL interception and corporate proxies tend to block.

If the failure is simply that OmniScope cannot reach the activation service, recent builds also switch you straight to the **Offline activation** tab and show the QR / file recovery flow automatically.

1. Go to [timeinpixels.com/my-license](https://timeinpixels.com/my-license/) and log in with your license email and key.
2. Click **Get Activation Code** next to your license.
3. In OmniScope, open the **License** menu and paste the activation code instead of the email + key.

Full instructions: [License Activation → Activation Code](/nobe-omniscope/license/license-activation#activation-code).

## I got "Exceeded number of activations" — how do I reset?

This happens when a machine was reformatted, wiped, or replaced without deactivating OmniScope first. Reset it yourself from the web:

1. Log in at [timeinpixels.com/my-license](https://timeinpixels.com/my-license/) with your license email and key.
2. You'll see all current activations — click **Reset** next to the machine you want to release.
3. Reset requests are approved manually, typically within a few hours on business days.
4. Once approved, activate normally on the new machine.

If deactivation from inside the app fails with a runtime error, quit OmniScope, open the logs folder (**Options → Open Logs**), delete the `appdata` file, then restart and activate again.

## Can I move my license to a new computer?

Yes. One license activates on up to **2 machines simultaneously** (Windows and macOS can be mixed). To move it:

1. On the old machine: **License → Deactivate License**. This frees the slot immediately.
2. On the new machine: activate normally with your email and license key.

If the old machine is no longer accessible (wiped, stolen, failed), request an activation reset from [timeinpixels.com/my-license](https://timeinpixels.com/my-license/).

## How do I change the email address on my license?

Customers can't self-service this — contact support with:

* The old (current) email address
* The new email address
* Your license key (helpful but not required)

After the change, deactivate and reactivate on your machines so the new address is stored locally. For subscription customers, Paddle billing details may also need to be updated so renewal invoices go to the correct address.

## Can I reset or extend the trial?

Yes. Contact support with your trial key (it starts with `NMTR`) and we'll reset it server‑side. The 14-day trial unlocks the full **Pro** feature set, so there's no need to buy just to test a feature.

A new trial can be requested directly from inside the application — no web form needed. See [Trial License](/nobe-omniscope/license/trial-license).

## How do I upgrade from Video to Pro?

1. Contact support and request an upgrade.
2. You'll receive a personal coupon code that reduces the Pro price to the upgrade delta (the difference between Video and Pro list pricing).
3. Place a new order for **Nobe OmniScope Pro** and enter the code at checkout.
4. Once confirmed, the old Video license is removed from your account.

Full details: [Video to Pro Upgrade](/nobe-omniscope/license/video-to-pro-upgrade).

## Which BlackMagic capture card should I buy?

OmniScope needs a **capture card (input device)** — not a monitor / output‑only card. Look for the word **Recorder** in the product name:

**Default recommendation: UltraStudio Mini Recorder 12G.** For a standalone / dedicated scope machine on Thunderbolt it's the most cost-effective option — it captures everything up to UHD 2160p60 over 12G-SDI for considerably less than an UltraStudio 4K Mini.

| Use case                                           | Recommended card                                                       |
| -------------------------------------------------- | ---------------------------------------------------------------------- |
| Standalone scope machine on Thunderbolt (up to 4K) | **UltraStudio Mini Recorder 12G**                                      |
| HD / 1080p on Thunderbolt, lowest cost             | UltraStudio Recorder 3G                                                |
| Capture **and** output on the same Mac             | UltraStudio 4K Mini                                                    |
| 4K / UHD on PCIe (Windows)                         | DeckLink Mini Recorder 4K / DeckLink Recorder 4K / DeckLink 4K Extreme |
| SDR + HDR simultaneous monitoring                  | DeckLink 8K Pro                                                        |
| Quad-link SDI from BVM-X300                        | Teranex → 12G, or DeckLink 4K Extreme 12G                              |

**These cards will NOT work as OmniScope input** (they are output-only):

* UltraStudio Monitor 3G
* DeckLink Mini Monitor 4K

AJA capture cards are also fully supported. USB capture devices (Elgato, Magewell) work for basic testing but are limited to 8-bit 4:2:0 and aren't recommended for professional QC. More detail: [DeckLink & UltraStudio](/nobe-omniscope/sources/decklink-and-ultrastudio).

## What hardware do I need to run OmniScope?

OmniScope is **GPU-bound**, not CPU-bound — the GPU matters more than clock speed. Customer-confirmed baselines:

* **macOS** — Mac mini M2 Pro for UHD, or the base Mac mini M4 (16 GB) for the current best value. MacBook Pro M3/M4 also works well.
* **Windows** — RTX 2060 or better for UHD; GTX 1060 is the floor for 1080p. If you're running OmniScope on the same machine as DaVinci Resolve, GPU resources are shared — a dedicated scope machine is recommended for production use.
* **RAM** — 16 GB or more for UHD + QC workflows.

Full details: [Requirements](/nobe-omniscope/requirements).

## My scopes don't match DaVinci Resolve's built-in scopes

Almost always one of two things:

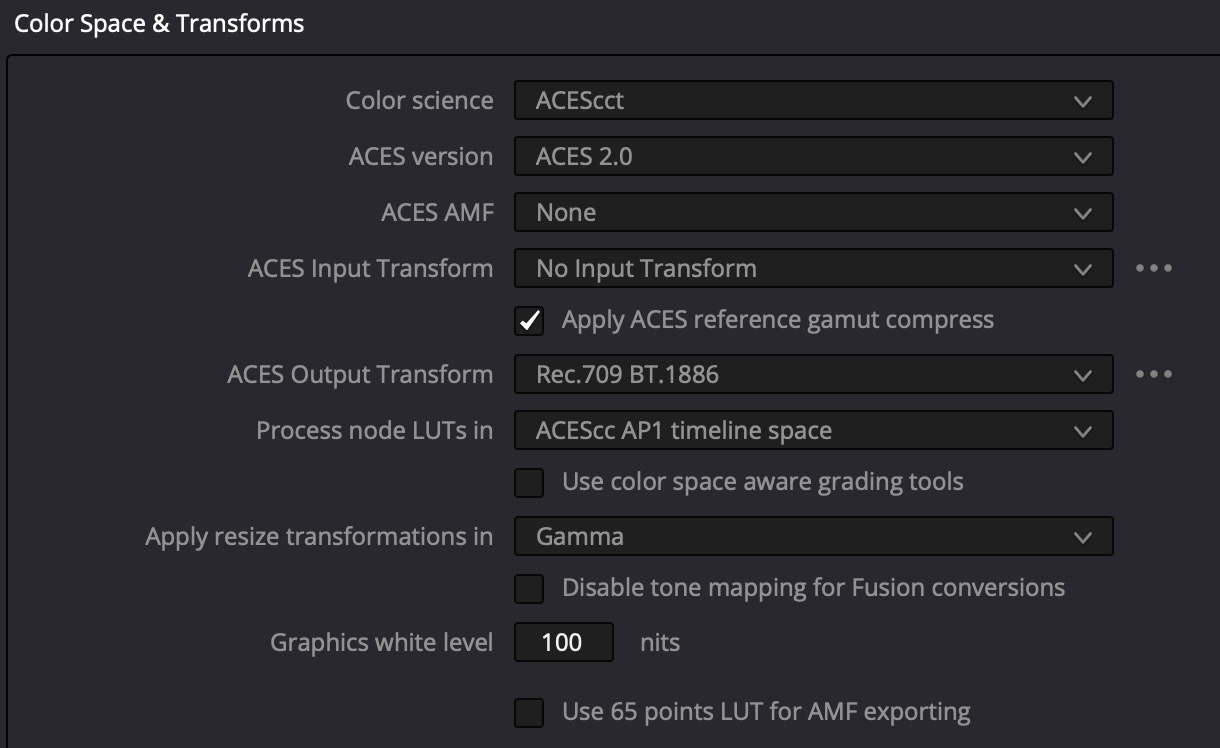
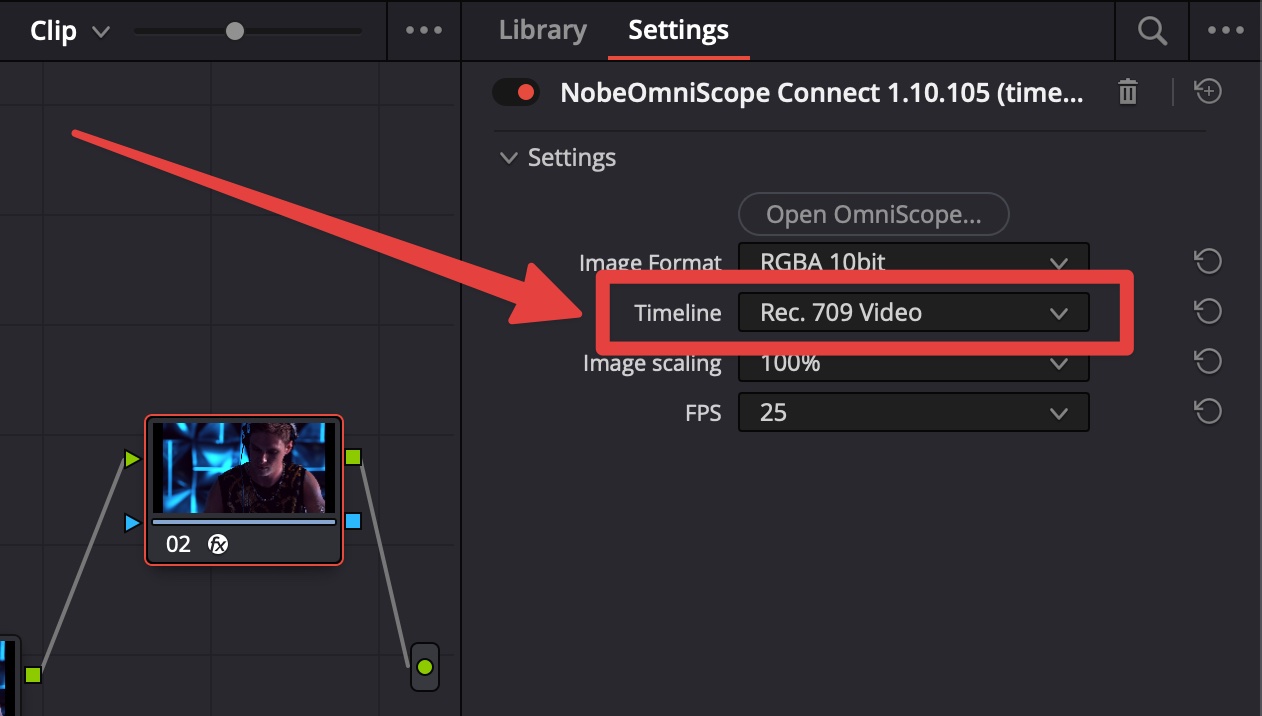
1. **Color-managed timeline (DWG / ACES / RCM / P3).** The OFX plugin receives the raw timeline colorspace, not your output transform. Use a CST node to convert to Rec. 709 before the OmniScope OFX node, and set the OFX colorspace to Rec. 709. See [Color-managed Timeline](/nobe-omniscope/sources/davinci-resolve-ofx/color-managed-timeline).
2. **Video vs. Full range mismatch.** RGB from Resolve is typically Full range; SDI / YCbCr is Video (legal) range. Match the range in OmniScope's input settings (gear icon → Common tab) to what Resolve is sending. See [Signal Range](/nobe-omniscope/sources/davinci-resolve-ofx/signal-range).

## The OFX plugin doesn't appear in DaVinci Resolve

1. Make sure OmniScope is up to date and install the plugin from **Options → Plugins** inside the app.
2. If the plugin still doesn't appear, or shows "Failed to load", reset the OpenFX cache: see [OpenFX Plugin is Not Loading](/nobe-omniscope/troubleshooting/openfx-plugin-is-not-loading).
3. On macOS, if the OmniScope menu bar only shows "Window" (no Options menu), apply the [Missing Menu Items on macOS](/nobe-omniscope/troubleshooting/missing-menu-items-on-macos) workaround first.
4. On Windows, check **Resolve → Preferences → Video I/O and GPU → OpenFX** and re-enable the plugin if it was unchecked after a Resolve update.

## Do you offer studio / volume / per-room licensing?

Yes. For facilities and teams:

* **Standard Pro** — includes 2 seats for one user across 2 machines. Not for simultaneous use by different operators.
* **Studio / per-room** — one license per workstation, regardless of how many people share it at different times.
* **Floating** — concurrent-seat licensing for teams that need to move between many machines or cloud workstations.
* **Volume** — larger orders qualify for a discount.

Volume, studio, and floating pricing is arranged directly via support — it isn't available through standard checkout. Contact us with the number of seats or rooms needed for current pricing and a quote.

## Does OmniScope support Linux?

No. Windows and macOS only. Linux is on the long-term roadmap but not a near-term priority.


# Requirements

Software and hardware requirements, OS and more

## Operating system

Nobe OmniScope runs on both Windows and macOS.

The minimum requirements are:

* Windows 10 or later,
* macOS High Sierra (10.13) or later.
  * Intel based Macs
  * Apple Silicon based Macs (M1/M2/M3/M4)

{% hint style="info" %}
Windows 7 and macOS 10.10 are supported with 1.9.26 version of OmniScope.
{% endhint %}

## Hardware requirements

### GPU Requirements by Platform

| Platform    | Backend    | Requirements                       |
| ----------- | ---------- | ---------------------------------- |
| **macOS**   | Metal      | Any Mac with Metal support (2012+) |
| **Windows** | DirectX 11 | DirectX 11 compatible GPU          |

{% hint style="info" %}
Starting with version 1.11.25, OmniScope on Windows uses **DirectX 11** as the rendering backend, replacing the previous OpenGL + OpenCL backend. This provides improved performance and better compatibility with modern Windows systems.
{% endhint %}

{% hint style="info" %}
Nobe OmniScope will also work on integrated Intel GPU chips but the performance might not be optimal.
{% endhint %}

## Performance Considerations

### Recommended system for external scope setup running macOS

We have thoroughly tested multiple Mac systems and found out that **M2 Pro Mini 16GB Ram** to be the ideal choice for UHD signal monitoring.

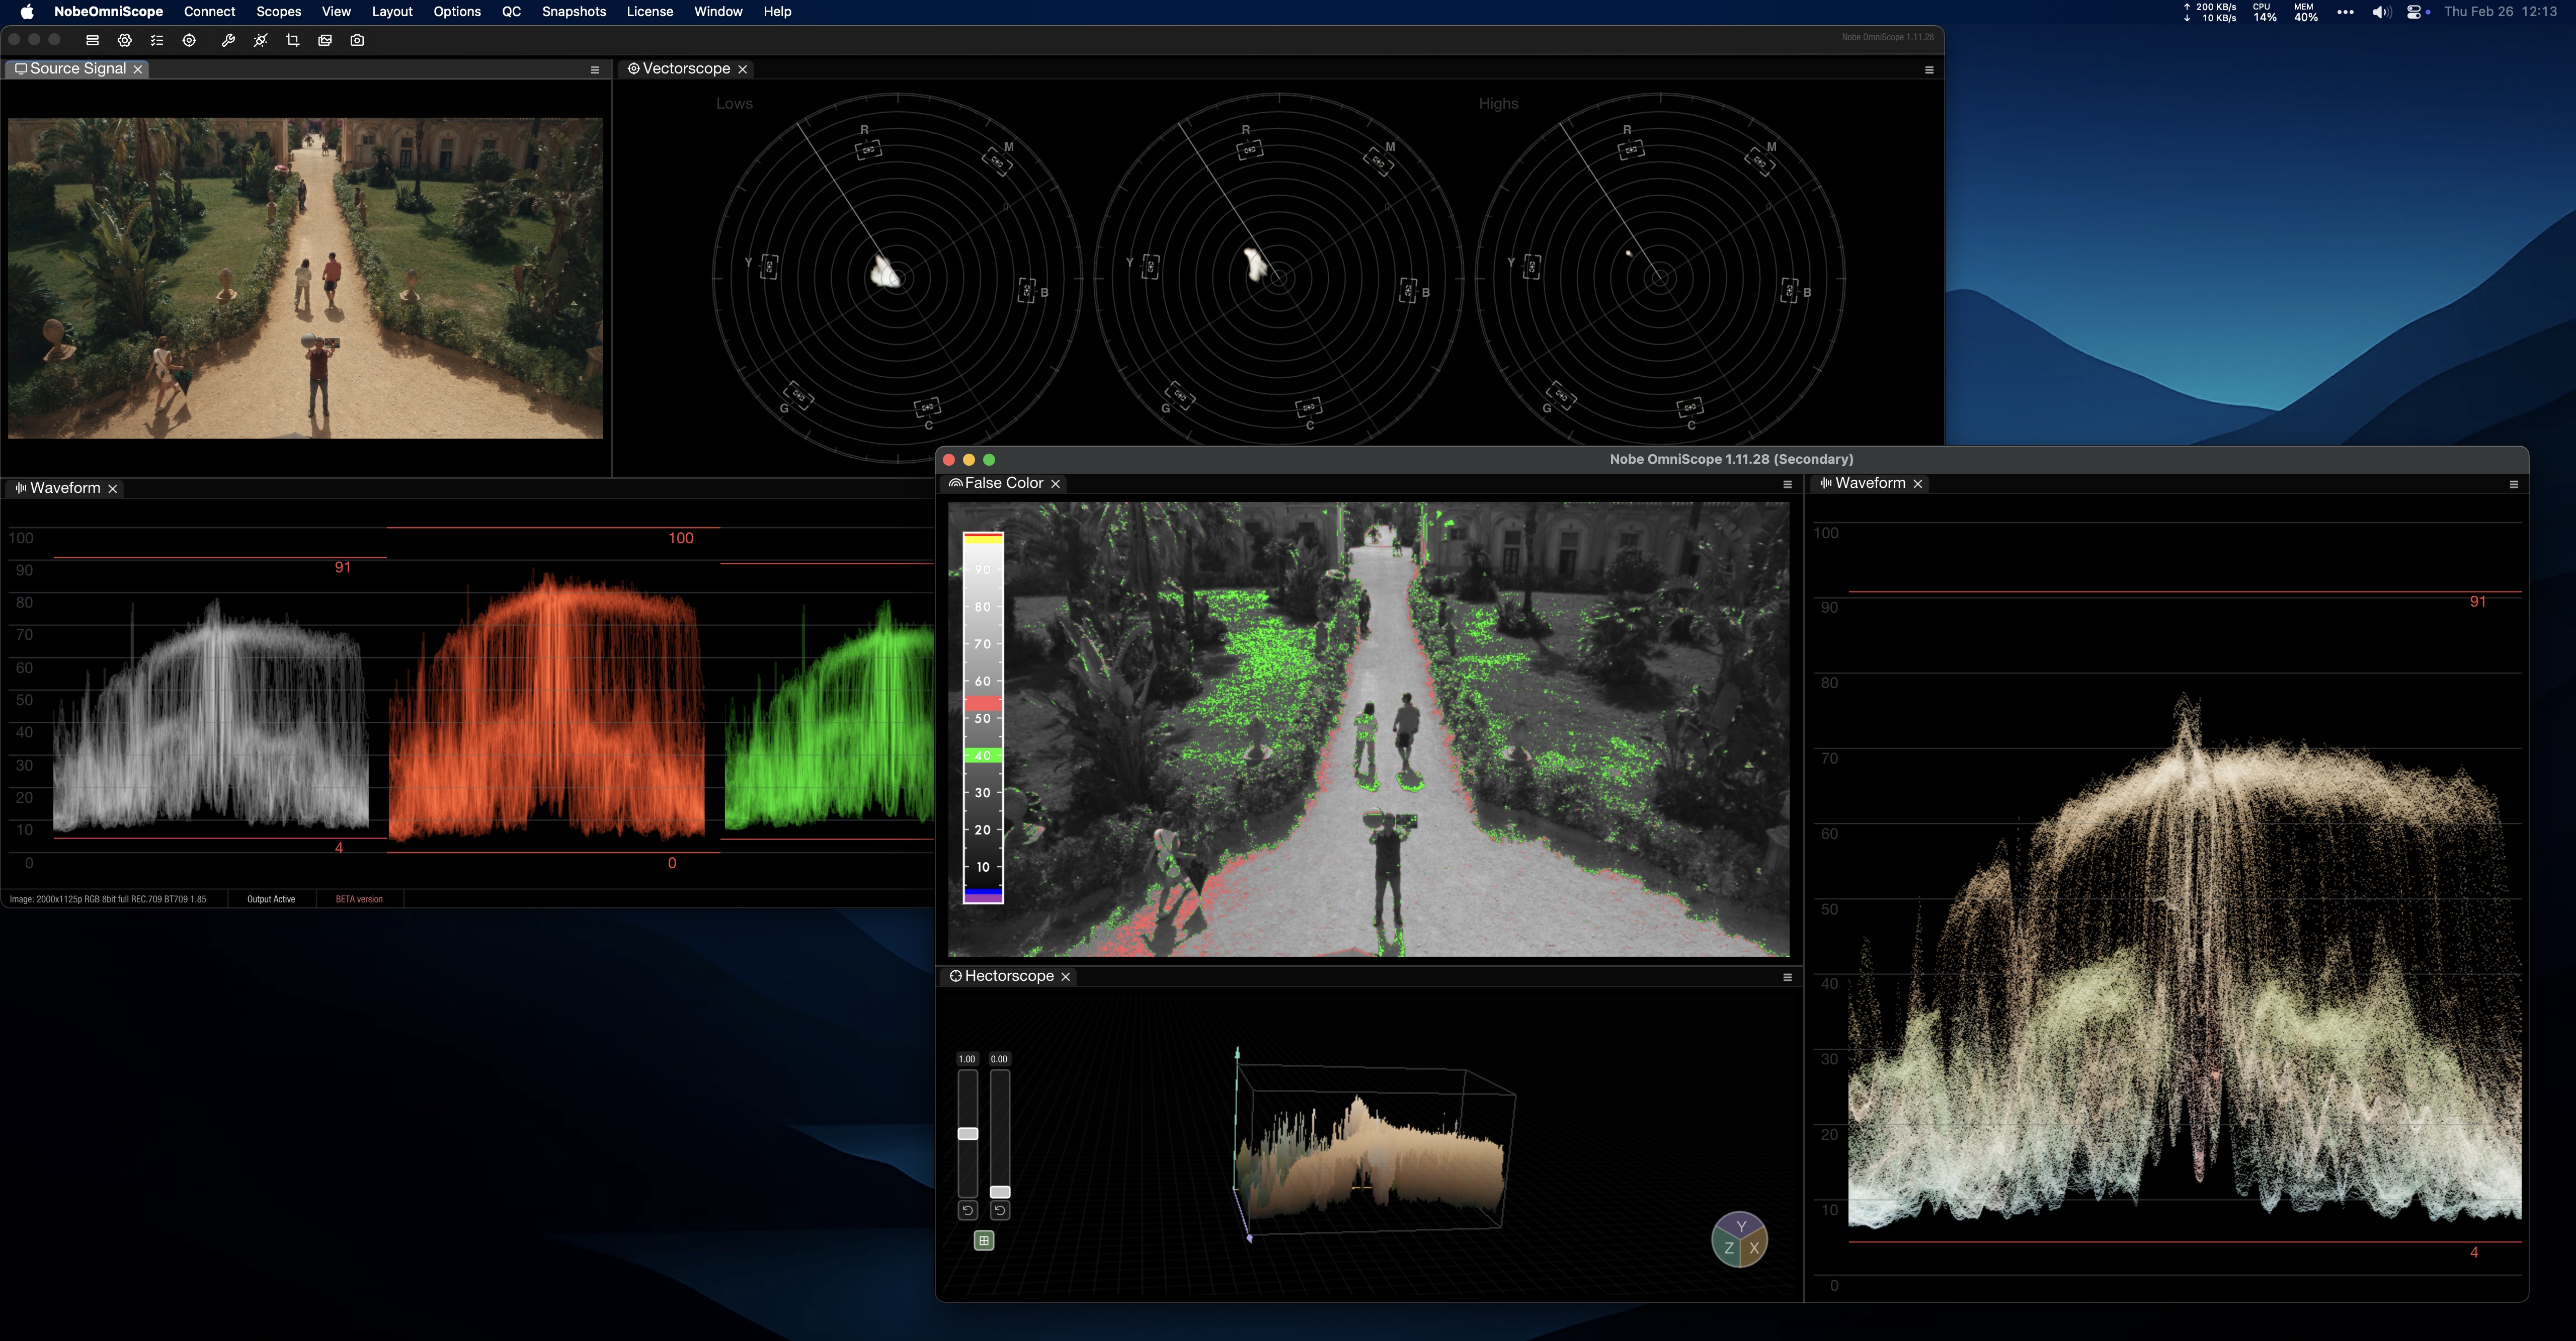
Here's a screenshot from our test layout:

<figure><img src="https://565437294-files.gitbook.io/~/files/v0/b/gitbook-x-prod.appspot.com/o/spaces%2F-MFqn5MuayPgQPMZ9pwf%2Fuploads%2FVkWnSCYZISJV9Bxwx5j6%2F2023-11-02_m2_pro_mini.png?alt=media&amp;token=81aa1607-0b5f-4fc3-b950-f2b224bb0c3e" alt=""><figcaption><p>M2 Pro Mini 16 GB Ram</p></figcaption></figure>

The layout consists of:

* Source viewer,
* RGB Parade,
* Luminosity Waveform,
* LMH Vectorscope,
* CIE Plot,
* Histogram,
* QC Timeline view.

On top of that there are all the QC features enabled:

* Gamut check,
* HDR gamut check,
* HDR statistics,
* Blanking Detection.

There's no scaling or performance settings applied - everything is running with the native UHD signal (10bit YCbCr 4:2:2 through DeckLink 8K Pro).

OmniScope runs reliably with no dropped frames.

{% hint style="success" %}
**Capture device for a standalone scope Mac:** the **UltraStudio Mini Recorder 12G** is our default recommendation. It connects over Thunderbolt, captures up to UHD 2160p60 over 12G-SDI, and is the most cost-effective way to feed a dedicated scope machine. See [Dedicated Scope PC](/nobe-omniscope/sources/decklink-and-ultrastudio/dedicated-scope-pc).
{% endhint %}

### Cheaper options

Using the same layout as above, but without the QC tools on **M1 Mini with 8GB RAM**:

<figure><img src="https://565437294-files.gitbook.io/~/files/v0/b/gitbook-x-prod.appspot.com/o/spaces%2F-MFqn5MuayPgQPMZ9pwf%2Fuploads%2FScVvbbncoFfFroyx95nb%2Fm1_mini.png?alt=media&amp;token=3c517770-bf92-4293-9fae-bea4495e858f" alt=""><figcaption><p>M1 Mini 8GB Ram</p></figcaption></figure>

The system runs reliably without losing frames on up to **2K 1080p** 30 fps.

By applying some scaling settings and performance options it's **possible to monitor UHD** signal with the same machine.

***

### Windows based systems

#### FullHD monitoring

For FullHD only monitoring you can get away with as low as GTX 750 GPU or similar.

{% hint style="info" %}
Integrated **Intel** graphics chips are generally not recommended.
{% endhint %}

#### UHD 30p monitoring

For a smooth UHD 30p workflow we recommend PC builds with GPUs like RTX 2060 or stronger.

Our test system that performs perfectly smoothly with the above layout and all the QC features enabled in UHD 30p:

* nVidia RTX 2060,
* Intel Core i5-13400F,
* Gigabyte Z790 AORUS ELITE AX,
* Kingston Fury Beast Black 32GB DDR5,
* DeckLink Mini Recorder 4K.

#### UHD 50p / 60p monitoring

For UHD workflows at 50p or 60p frame rates, we recommend stepping up the GPU to handle the increased throughput:

* NVIDIA RTX 3060 12 GB (or stronger),
* Intel Core i5-13400 / AMD Ryzen 5 7600 (or stronger),
* 16 GB DDR5 RAM,
* NVMe SSD storage,
* DeckLink Mini Recorder 4K (PCIe) or UltraStudio Mini Recorder 12G (Thunderbolt).

{% hint style="info" %}
These are general guidelines based on our testing experience. Actual performance depends on layout complexity and how many scopes/QC features are active simultaneously. NVIDIA GPUs are strongly recommended on Windows — our DirectX 11 backend works most reliably with NVIDIA cards. We also recommend using **Studio (SD)** drivers over Game Ready drivers for stability in professional workflows.
{% endhint %}


# Installation


# Windows

Installation on Windows

To install Nobe OmniScope run the installer and follow the on-screen instructions.

All the associated plugins will be installed automatically (OFX for DaVinci Resolve, Adobe Premiere Pro / AE transmitter and Assimilate Scratch SDI plugin).

{% hint style="info" %}
The Windows installer no longer prompts for a system reboot after installation. If a reboot was previously required for your setup, it is no longer needed.
{% endhint %}

## Plugins

Plugins are installed into these locations:

* OFX for DaVinci Resolve:

  ```
  C:\Program Files\Common Files\OFX\Plugins\NobeOmniScopeConnect.ofx.bundle
  ```
* Adobe Premiere Pro & After Effects:

  ```
  C:\Program Files\Adobe\Common\Plug-ins\7.0\MediaCore
  ```

  �
* Assimilate Scratch:

  ```
  C:\ProgramData\Assimilator\plugin64\SDI
  ```

  �


# macOS

Installation on macOS

To install Nobe OmniScope on macOS, open the DMG file and drag the app to the `/Applications` folder.

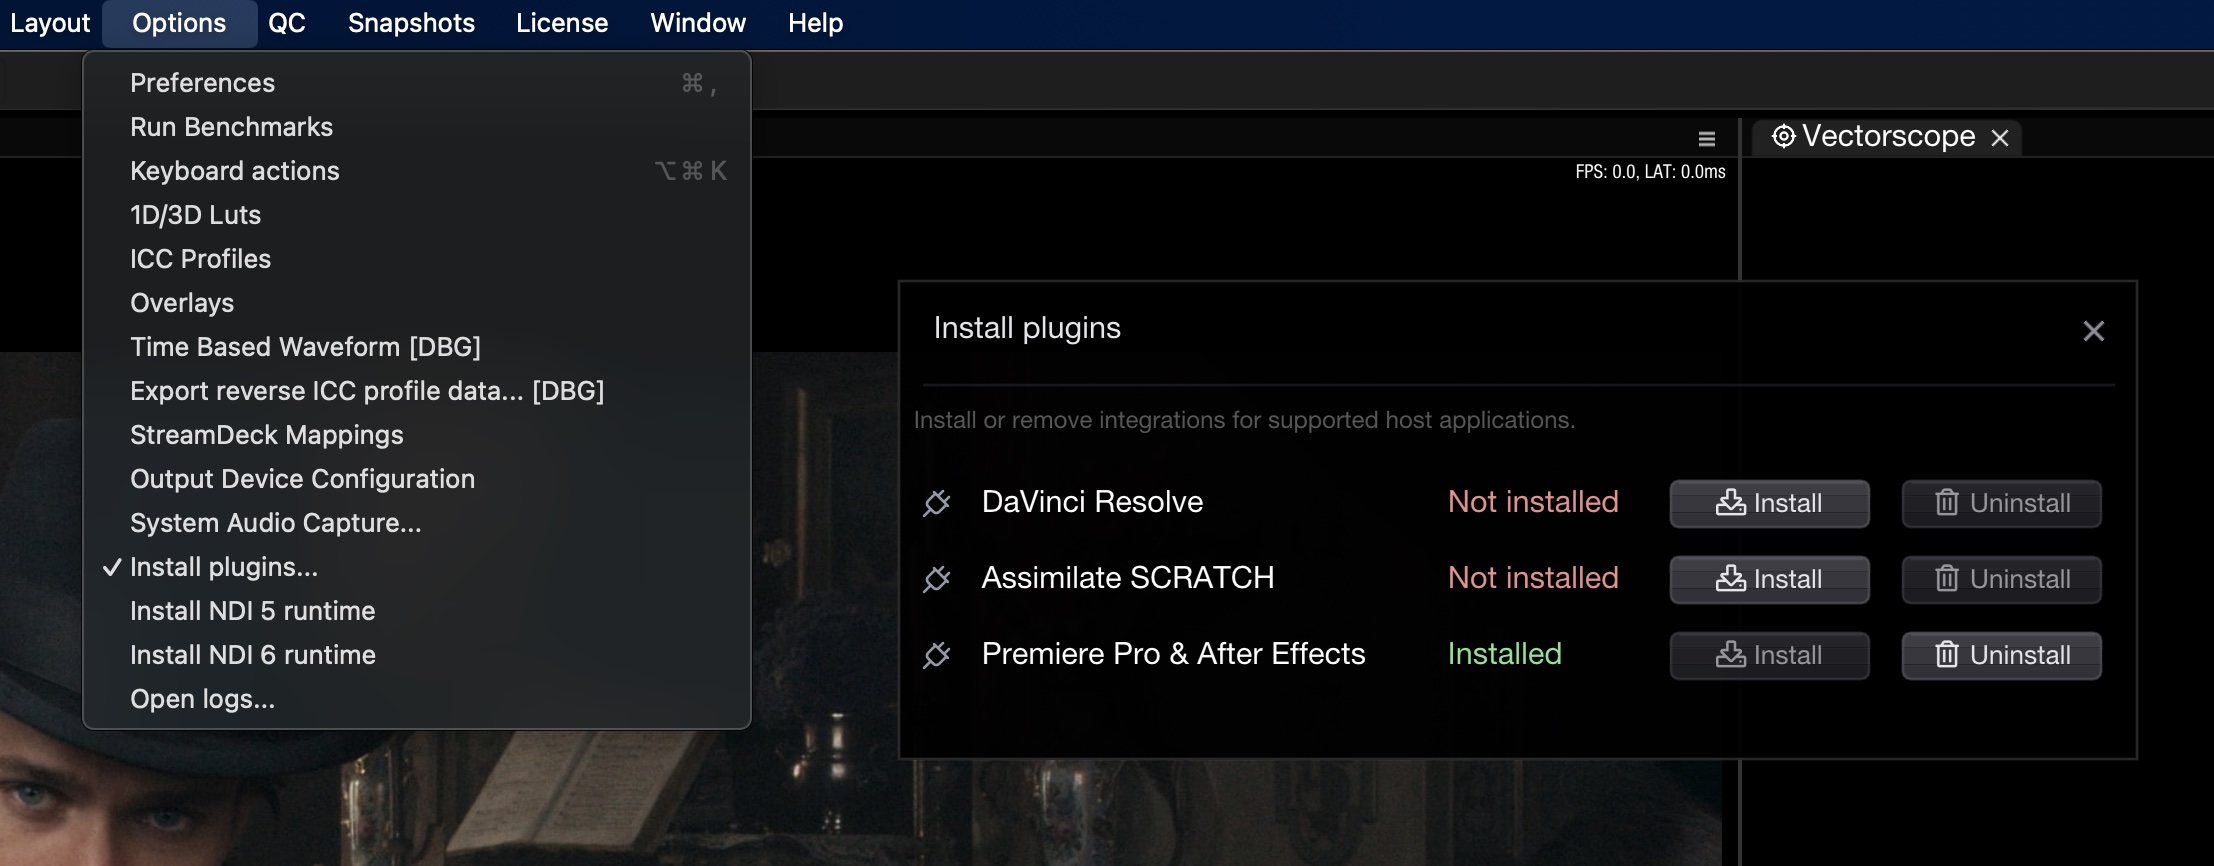
To install associated plugins (DaVinci Resolve, Premiere Pro / AE, Assimilate Scratch) select **Options / Install plugins…**

<figure><img src="https://565437294-files.gitbook.io/~/files/v0/b/gitbook-x-prod.appspot.com/o/spaces%2F-MFqn5MuayPgQPMZ9pwf%2Fuploads%2Fgit-blob-85f934ce81d2aec657a6191bb20c3f3ea9c3b61d%2F2026-02_install_plugins_macos.jpg?alt=media" alt=""><figcaption><p>Install individual plugins</p></figcaption></figure>

## Plugins

Plugins are installed into these locations:

* OFX for DaVinci Resolve:

  ```
  /Library/OFX/Plugins/NobeOmniScopeConnect.ofx.bundle
  ```

  �
* Adobe Premiere Pro & After Effects:

  ```
  /Library/Application Support/Adobe/Common/Plug-ins/7.0/MediaCore/NobeOmniScopeTransmitter.bundle
  ```

  �
* Assimilate Scratch:

  ```
  /Library/Application Support/Assimilator/Plugins/SDI/NobeOmniScope.dylib
  ```

  �


# Downloads

How to access all versions downloads

You can access Nobe OmniScope downloads in the downloads section on our website:\
<https://timeinpixels.com/downloads/>

### Older versions of OmniScope

The downloads page now includes direct links to currently listed older OmniScope builds:

<https://timeinpixels.com/downloads/>

For additional historical builds tied to your license, use the license panel on our website:

<https://timeinpixels.com/my-license/>

To access the license page use the license key to the software and your email address associated with the license key.

Once you are logged-in, use the **Looking for older version download link:**

<figure><img src="https://565437294-files.gitbook.io/~/files/v0/b/gitbook-x-prod.appspot.com/o/spaces%2F-MFqn5MuayPgQPMZ9pwf%2Fuploads%2FphfaDF2bCwEpqNWNHjR7%2FCleanShot%202023-12-30%20at%2018.08.03%402x.png?alt=media&amp;token=dfabcc49-b5ba-437d-b66a-0eab932c3a8a" alt=""><figcaption></figcaption></figure>


# StreamDeck

StreamDeck plugin installation

StreamDeck plugin can be downloaded from the following location:\
💾[ https://timeinpixels.com/download/78500/](https://timeinpixels.com/download/78500/)

Unzip the plugin file and double-click it to launch the StreamDeck installer.

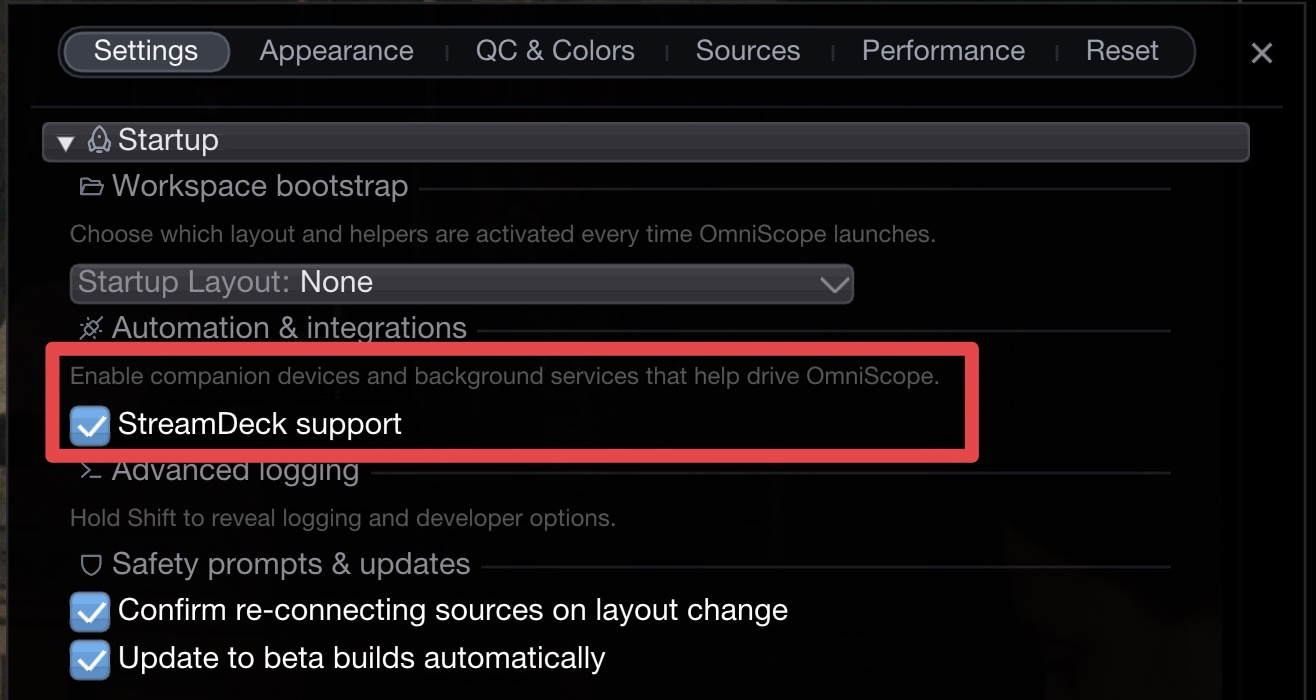
To start using your StreamDeck controller, enable it in the **Settings / Preferences** window in OmniScope.

<figure><img src="https://565437294-files.gitbook.io/~/files/v0/b/gitbook-x-prod.appspot.com/o/spaces%2F-MFqn5MuayPgQPMZ9pwf%2Fuploads%2Fgit-blob-04c7063eb2b7dcaa2b66e0f66dc7ab9a3fd95f44%2F2026-02_streamdeck_config.jpg?alt=media" alt=""><figcaption><p>Enable StreamDeck support in Preferences</p></figcaption></figure>

For remote setups, use the **OmniScope Connection** action in Stream Deck to enter the shared OmniScope IP / Host and Port. After that, regular **Nobe OmniScope** actions only need the per-tile channel.

Starting with the **1.11.41** plugin build, OmniScope Stream Deck actions explicitly support **Multi Actions**, so you can combine them with other Stream Deck steps inside a single automation.

## Dials Support

OmniScope supports **StreamDeck+ dials** (rotary encoders) for hands-on, tactile control of your scopes. The following dial actions are available:

### Waveform

* **Shadow Zoom** — Rotate to zoom into the shadow region of the waveform for precise low-end analysis
* **Highlight Zoom** — Rotate to zoom into the highlight region for detailed high-end inspection
* **Brightness** — Adjust the overall brightness of the waveform trace

### Vectorscope

* **Zoom** — Rotate to zoom in and out of the vectorscope for detailed color analysis

Dials provide real-time, proportional control — ideal for quickly inspecting different tonal ranges without touching the mouse.


# License


# General information

Activation, reset and subscription information

### How many machines can I activate at the same time?

Each Nobe OmniScope license may be used in one of two ways: as a per-user license or as a per-room license.

#### Per-User License (Two-System User License)

* Intended for the exclusive use of a single person.
* May be installed and activated on up to two personal systems (e.g., desktop and laptop, or Windows and macOS).
* Cannot be used simultaneously on both systems.
* May not be shared between multiple users.

{% hint style="info" %}
Nobe OmniScope Pro originally shipped with 3 seats, and later changed to 2 seats at the same price. Some legacy customers may still have a 3-seat license. If you only use 2 machines and would like your legacy 3-seat license reduced to 2 seats, please [contact support](https://timeinpixels.com/contact).
{% endhint %}

#### Per-Room License

* Intended for facilities and studios that wish to license OmniScope for a specific color suite, bay, or workstation.
* The license covers that suite/system, regardless of who operates it.
* Multiple rooms or suites each require their own license.

{% hint style="info" %}
Note: A single license cannot be applied both per-user and per-room at the same time. For larger facilities or enterprise setups where multiple users or rooms require concurrent access, please contact us about multi-seat or [floating license](/nobe-omniscope/license/floating-licenses) options.
{% endhint %}

### How to request a license activation reset

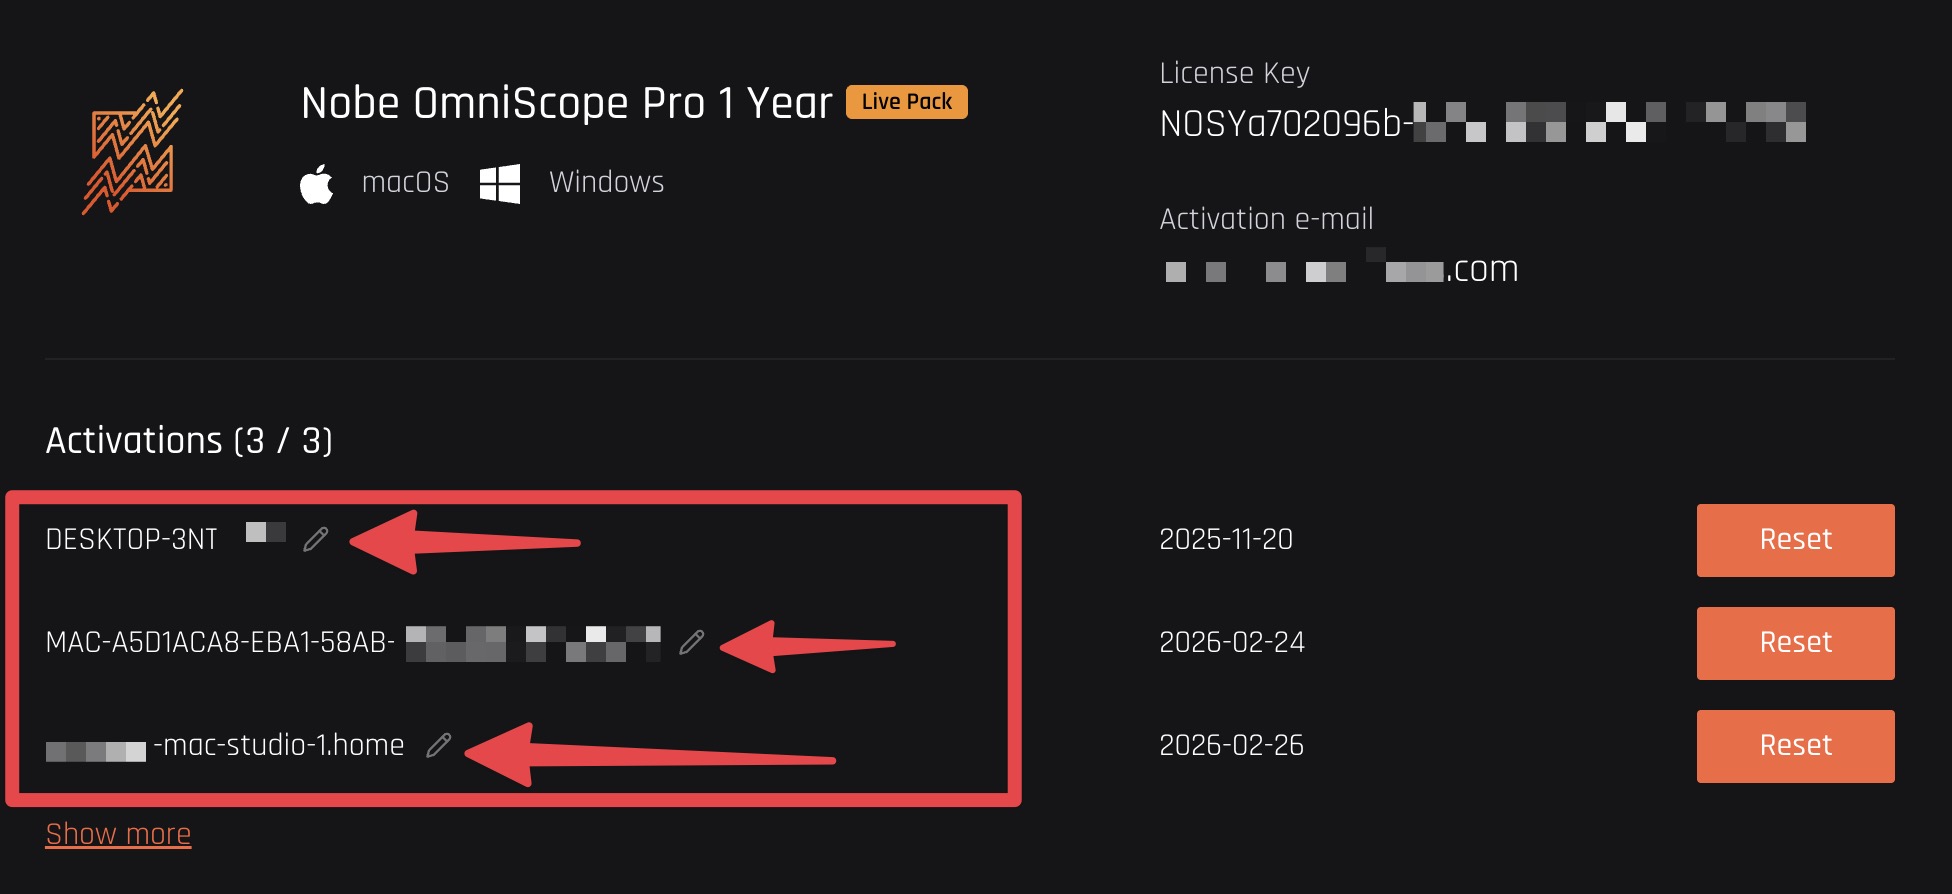
When you need to reset your activations you can request a license reset using the [my license page](https://timeinpixels.com/my-license/).

The app and the website now show each activation using a friendly **Machine Name** so it is easier to identify the correct workstation before removing or reviewing an activation. You can rename the machine from OmniScope or from the website, and the new name will sync both ways.

<figure><img src="https://565437294-files.gitbook.io/~/files/v0/b/gitbook-x-prod.appspot.com/o/spaces%2F-MFqn5MuayPgQPMZ9pwf%2Fuploads%2Fgit-blob-aca2125c751223306fc9f7c29aabca5c8923c9c7%2F2026-03_machine_name_web.jpg?alt=media" alt=""><figcaption><p>Machine Names on the My License page</p></figcaption></figure>

{% hint style="info" %}
The Hardware ID is still the real activation identity. Machine Name is only a display label and is kept separate for support and offline activation workflows.
{% endhint %}

### Subscription status

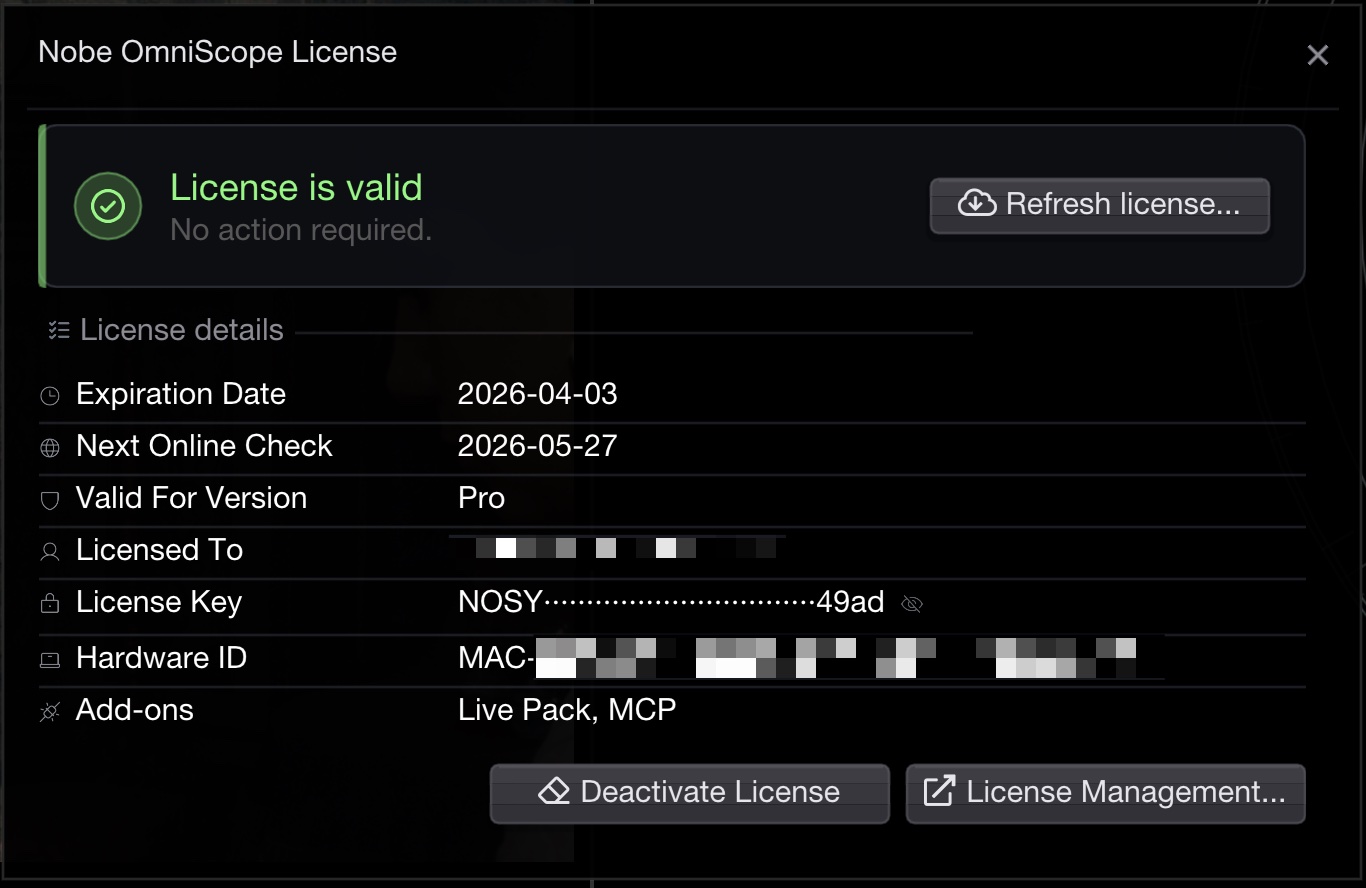
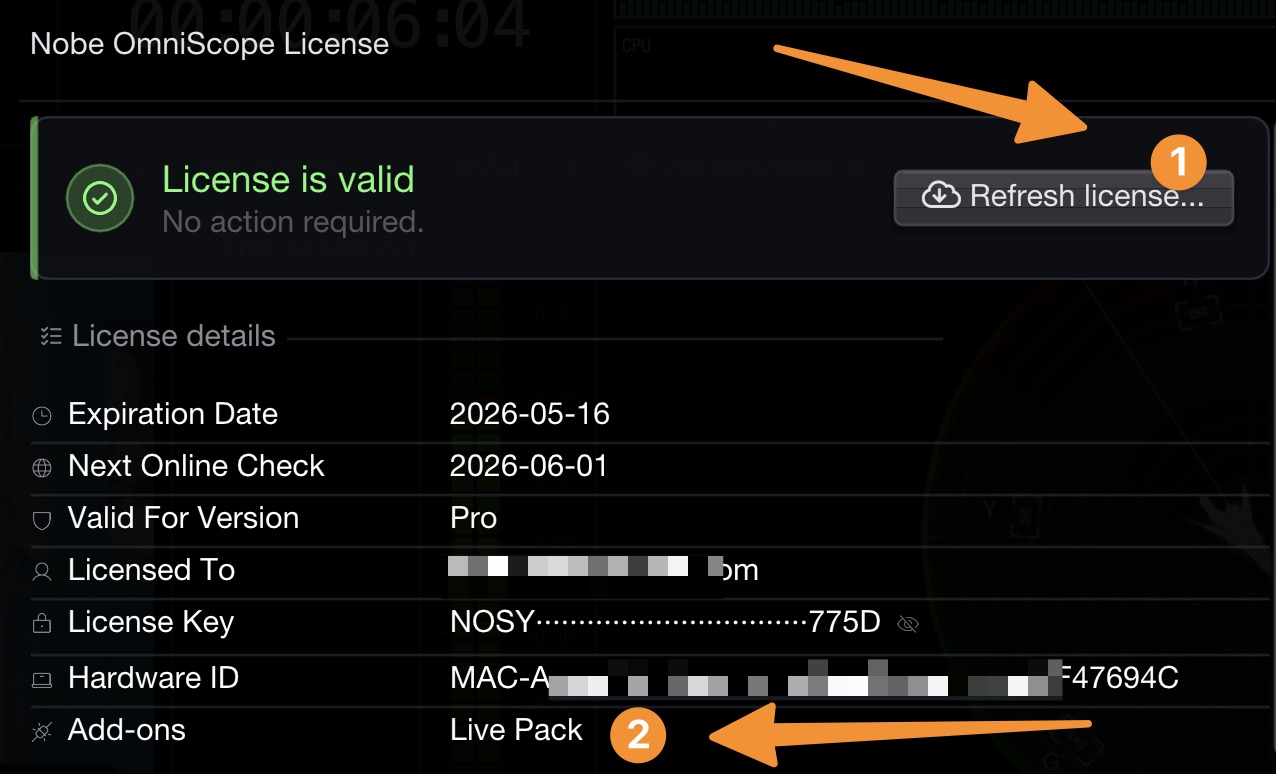
You can check your subscription status by visiting the link from your order email, or directly from the application via **License / License Info**:

<figure><img src="https://565437294-files.gitbook.io/~/files/v0/b/gitbook-x-prod.appspot.com/o/spaces%2F-MFqn5MuayPgQPMZ9pwf%2Fuploads%2Fgit-blob-527e2ec865c75bb05786ed5b4f8d403fd4bfe695%2F2026-02_license_info.jpg?alt=media" alt=""><figcaption><p>Subscription status</p></figcaption></figure>

From here you can check when your subscription expires, **review payment options**, or **cancel your subscription** by clicking the **Manage Subscription…** button.

### Add-ons in License Info

After a license refresh, OmniScope shows enabled add-ons in the **License Info** window. The website **My License** page mirrors the same add-on labels, including **Live Pack** and **PSE** when they are active on your license.


# Floating Licenses

Concurrent-seat licensing for studios, shared workstations, and cloud systems

**Nobe OmniScope Pro Studio Floating** is designed for teams that run OmniScope on many machines but only need a limited number of copies running at the same time.

Instead of binding the license to specific machines, one floating key provides a pool of **concurrent seats**. You can register the key on any number of workstations; the seat count limits how many can use OmniScope at the same time.

{% hint style="info" %}
Nobe OmniScope Pro Studio Floating is available by quote and is priced per concurrent seat. [Contact us](https://timeinpixels.com/contact) for current pricing and to discuss your team size and setup.
{% endhint %}

### How it works

1. Your team receives one floating license key with an agreed number of seats.
2. Register the key once on each workstation that needs OmniScope.
3. OmniScope remembers the credentials and requests a seat automatically on future launches.
4. When OmniScope quits or the license is deactivated, the seat is released for another workstation.
5. If a workstation crashes or disappears without quitting cleanly, its seat becomes available automatically within 30 minutes.

This makes floating licenses a good fit for shared suites, temporary workstations, and cloud systems that may be created and removed frequently.

### Activation

On each workstation:

1. Open **License > Register**.
2. Select the **License Key** tab.
3. Enter the **email address** and **floating license key** supplied with your order.
4. Click **Register** to request a seat.

The same credentials can be used on every workstation. Floating licenses do not consume machine activations and do not need activation resets.

{% hint style="warning" %}
Floating licenses require a direct internet connection to the license server. **Activation Code** and **Offline Activation** cannot be used with a floating key.
{% endhint %}

### License status

Open **License > License Info** to see:

* how many floating seats are currently in use;
* when the current seat will be renewed;
* the last successful server ping;
* the license expiration date, when the agreement has one;
* any add-ons included with the license.

OmniScope confirms the seat with the license server every few minutes. Renewed expiration dates and entitlement changes are applied while the app is running.

The [My License page](https://timeinpixels.com/my-license/) also shows floating licenses and lists the seats currently in use, including each machine name and when it was last seen.

### All seats in use

If every seat is already in use, OmniScope lists the workstations currently holding seats. Close or deactivate OmniScope on one of those systems, then click **Try Again** on the waiting workstation.

Need more seats? The seat count of an existing floating license can be increased at any time. [Contact us](https://timeinpixels.com/contact).

### Internet connection requirement

Floating seats are managed by our license server, so machines running OmniScope with a floating license need an **internet connection**.

If the connection is interrupted, OmniScope warns that contact with the license server was lost and shows the remaining lease time. The current seat stays active until that countdown reaches zero—normally up to 30 minutes from the last successful contact. If the connection returns in time, the seat renews automatically.

If the lease expires before the connection returns, OmniScope leaves licensed mode and starts the trial countdown. Restore the connection and obtain a seat again to continue using the floating license.

Fully offline or air-gapped machines should use a standard node-locked license instead.

### Releasing or deactivating a seat

Closing OmniScope normally releases the seat automatically. To release it without quitting:

1. Open **License > License Info**.
2. Click **Deactivate**.

Deactivation releases the seat and forgets the saved floating credentials on that workstation. It does not require approval or an activation reset on the My License website. Register the key again whenever that workstation needs another seat.

If a workstation is force-quit, loses power, or is deleted in the cloud, no action is required; the server reclaims its seat within 30 minutes.

### Features and add-ons

The floating product provides the **Nobe OmniScope Pro Studio** feature set. **Live Pack** can be included as an optional add-on in the floating-license quote. Enabled add-ons appear in **License Info** and follow the seat automatically on every workstation.

### Floating vs. standard license

|                             | Standard license                                 | Floating license                                       |
| --------------------------- | ------------------------------------------------ | ------------------------------------------------------ |
| Product                     | User or room license                             | Pro Studio Floating                                    |
| Bound to                    | Up to 2 systems for one user, or 1 licensed room | No fixed workstation                                   |
| Limit                       | Named activations and usage terms                | Purchased concurrent seats                             |
| Machine changes             | Deactivation or activation reset                 | Automatic                                              |
| Shared / cloud workstations | Limited                                          | Designed for it                                        |
| Works offline               | Yes                                              | No; an established seat tolerates a brief interruption |
| Availability                | Web store or direct sales                        | Quote-based, per-seat pricing                          |

### Getting a floating license

Floating licenses are not available in the web store. They are sold by quote as an annual, invoice-based license with a **3-seat minimum**. [Contact us](https://timeinpixels.com/contact) with the number of seats you need, whether you need Live Pack, and a few details about your setup. We will prepare a quote for Nobe OmniScope Pro Studio Floating.


# Trial License

How to request a trial license

## Video Step-by-step

{% embed url="<https://www.youtube.com/watch?v=corXqFe7kN0>" %}
How to request and activate a trial license
{% endembed %}

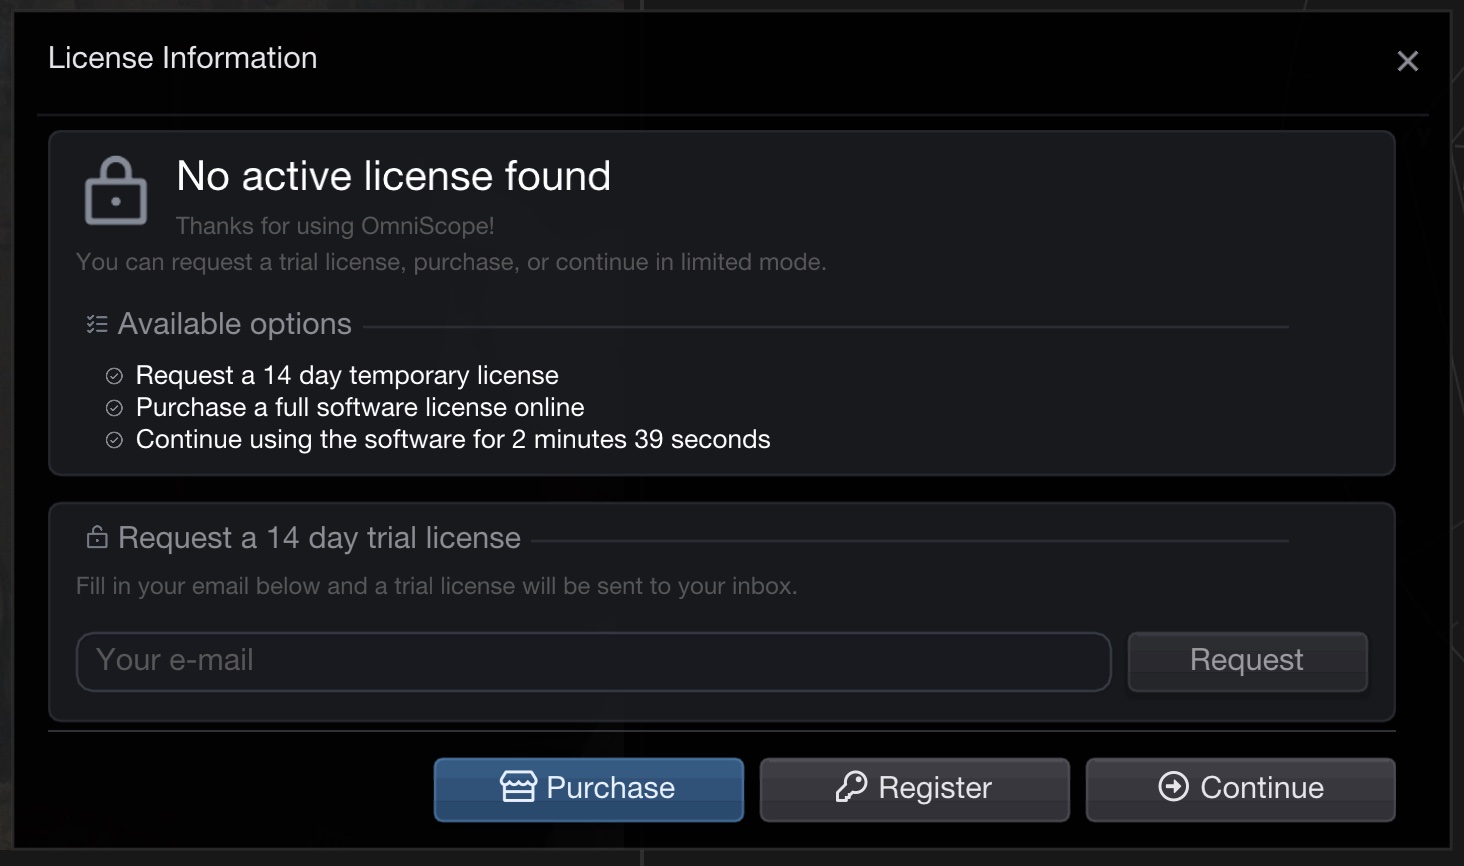
The trial license provides full Pro features for 14 days. You can request a trial license directly from the startup screen:

<figure><img src="https://565437294-files.gitbook.io/~/files/v0/b/gitbook-x-prod.appspot.com/o/spaces%2F-MFqn5MuayPgQPMZ9pwf%2Fuploads%2Fgit-blob-48b687c5d892d8660f2a9c0e1d9a02dffae6edc3%2F2026-02_trial_license.jpg?alt=media" alt=""><figcaption><p>Trial license request</p></figcaption></figure>

Enter your email address and press **Request**. The trial license key will be sent to your inbox.

{% hint style="warning" %}
The trial license can be activated on a given machine only once. If you have used a trial before and would like to try again, please [contact us](https://timeinpixels.com/contact/).
{% endhint %}


# Upgrade & Support Plan

Nobe OmniScope Pro & Video

The Upgrade & Support Plan is an optional, annual plan that provides owners of OmniScope application updates and priority support.

If you purchased OmniScope more than 12 months ago, we encourage you to join the plan and renew your license. Please note: This is not a standard subscription, which requires you to pay every year at a certain time to keep the license active. .

* Legacy owners of Nobe OmniScope can get current and renew the annual Upgrade & Support plan at any time. There is no penalty if your license is older than 12 months or you have passed on renewals.
* OmniScope licenses do not expire, you own it. You can cancel the Upgrade & Support plan at any time and keep the last version available at the time of cancellation.
* Renewal is priced per year, with separate rates for the Video Version and the default 2-seat Pro license. Current pricing is shown on our [website](https://timeinpixels.com/store) or available from [support](https://timeinpixels.com/contact).
* For personal Pro licenses, one user can activate the license on up to 2 personal machines.
* For studio / per-room licensing, renewal pricing is calculated per room (for example, 3 rooms is billed as 3 × the per-room rate).
* Add-ons such as Live Pack follow the license seat / room count of your OmniScope Pro license. Personal licenses use the 2-seat Live Pack base price, while Studio / per-room licenses use the full Live Pack price per licensed room.

{% hint style="info" %}
All new purchases of Nobe OmniScope include 1 year of free upgrades and support (Video & Pro Versions only).
{% endhint %}


# Perpetual License

Perpetual License and Volume Licensing options

If you purchase through Volume Licensing you will receive Perpetual License with no subscription fees and with access to lifetime updated.

[Contact us](https://timeinpixels.com/contact) for more details.


# Video to Pro upgrade

How to upgrade from Video license to a Pro license

If you own Video license of OmniScope it's possible to upgrade to the Pro license.

The upgrade link is available in the [license section on our website](https://timeinpixels.com/my-license/):

<figure><img src="https://565437294-files.gitbook.io/~/files/v0/b/gitbook-x-prod.appspot.com/o/spaces%2F-MFqn5MuayPgQPMZ9pwf%2Fuploads%2FqSTI6XCByDhmAeTsrDAU%2Fimage.png?alt=media&amp;token=f6c93a91-4e0f-4613-b5d9-6a12ed656fde" alt=""><figcaption><p>License management</p></figcaption></figure>

You can also access this page directly from OmniScope in the License menu:\ <br>

<figure><img src="https://565437294-files.gitbook.io/~/files/v0/b/gitbook-x-prod.appspot.com/o/spaces%2F-MFqn5MuayPgQPMZ9pwf%2Fuploads%2FSqIbrjG8InXWw6bSkvrv%2FCleanShot%202024-07-16%20at%2013.21.41%402x.png?alt=media&amp;token=410798af-315d-469f-a559-34f35739ac0b" alt=""><figcaption><p>Upgrade the license directly from OmniScope</p></figcaption></figure>

### Pricing

The upgrade price is calculated as follows:

**`Upgrade price`**` `` ``= (Pro license price) - (Video license price) + 15% `

The exact amount is shown at checkout and on our [website](https://timeinpixels.com/store), or [contact support](https://timeinpixels.com/contact) for a quote.


# License activation

How to activate the license using Activation code or License key

{% hint style="info" %}
Using a **Nobe OmniScope Pro Studio Floating** key? Register it through the **License Key** tab while connected to the internet. Activation Code and Offline Activation are only for standard licenses. See [Floating Licenses](/nobe-omniscope/license/floating-licenses).
{% endhint %}

## Video Step-by-step

{% embed url="<https://youtu.be/corXqFe7kN0>" %}
How to activate a temp license in OmniScope
{% endembed %}

## License Key

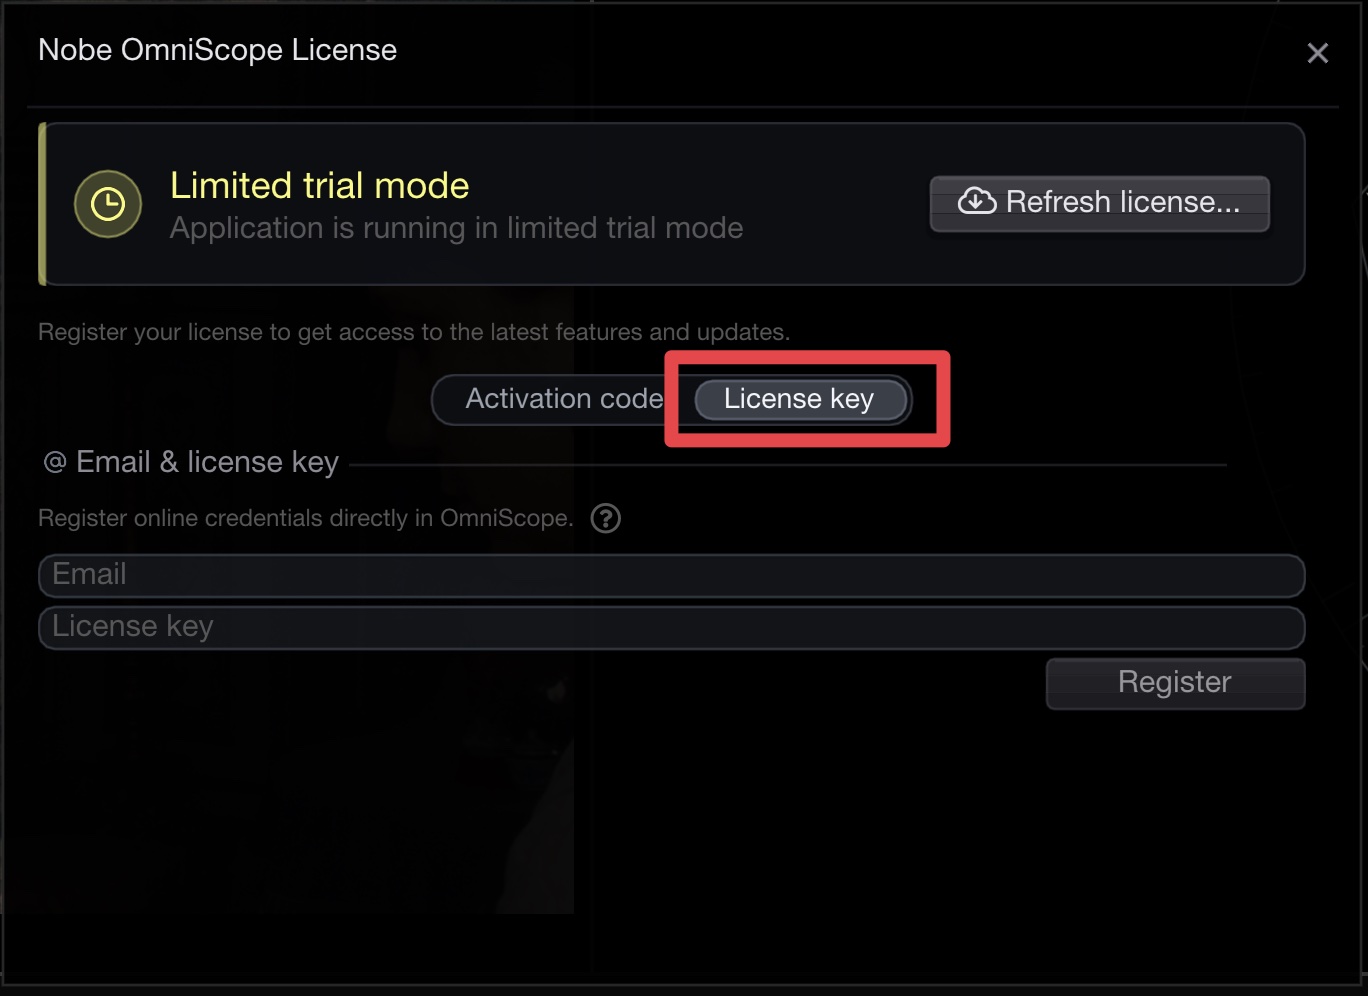
To activate Nobe OmniScope, open the **License** menu and select **Register**:

<figure><img src="https://565437294-files.gitbook.io/~/files/v0/b/gitbook-x-prod.appspot.com/o/spaces%2F-MFqn5MuayPgQPMZ9pwf%2Fuploads%2Fgit-blob-652688af693823b85014e5e17d85d9ddb3f52b2d%2F2026-02_license_key.jpg?alt=media" alt=""><figcaption><p>License Key</p></figcaption></figure>

In the registration window, select the **License Key** tab and paste your **Email address** and **License Key**.

If OmniScope cannot reach the activation service because the network is down or web requests are being blocked, it now opens the **Offline activation** tab automatically and shows the QR / file recovery path instead of leaving you at a generic failure message.

{% hint style="info" %}
Please note that 14 days temp license is always generated with **<temp@timeinpixels.com>** email address and you need to use this one here instead of your own email address.
{% endhint %}

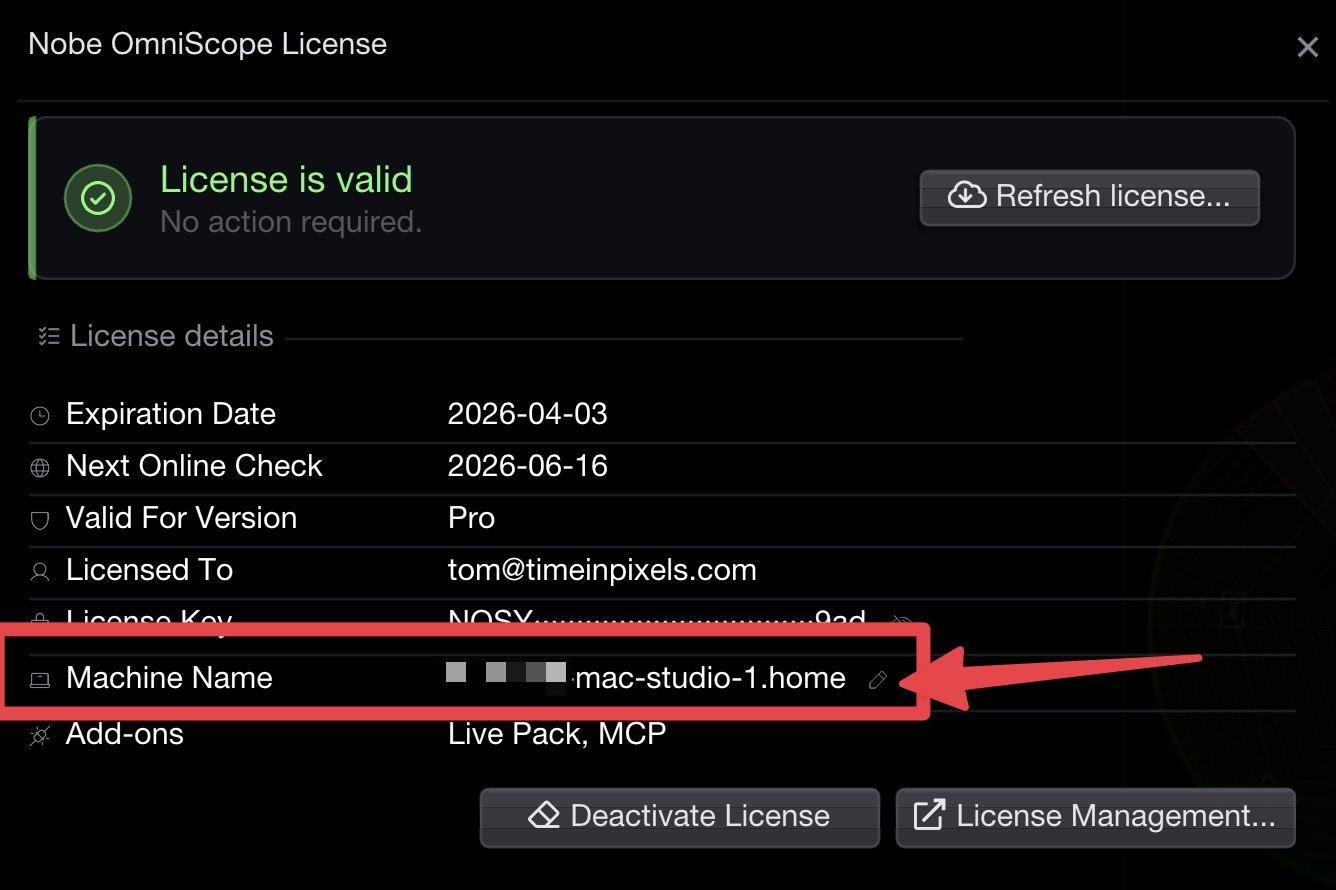
After activation, OmniScope shows the current system using a friendly **Machine Name** in the license window instead of only the raw Hardware ID. You can rename that machine directly in OmniScope or from the [My License page](https://timeinpixels.com/my-license/), and the updated name will sync both ways.

<figure><img src="https://565437294-files.gitbook.io/~/files/v0/b/gitbook-x-prod.appspot.com/o/spaces%2F-MFqn5MuayPgQPMZ9pwf%2Fuploads%2Fgit-blob-e1e069610679ee354961e3c057cb57ad4c089fb5%2F2026-03_machine_name_app.jpg?alt=media" alt=""><figcaption><p>Machine Name shown in OmniScope License Info</p></figcaption></figure>

## Activation Code

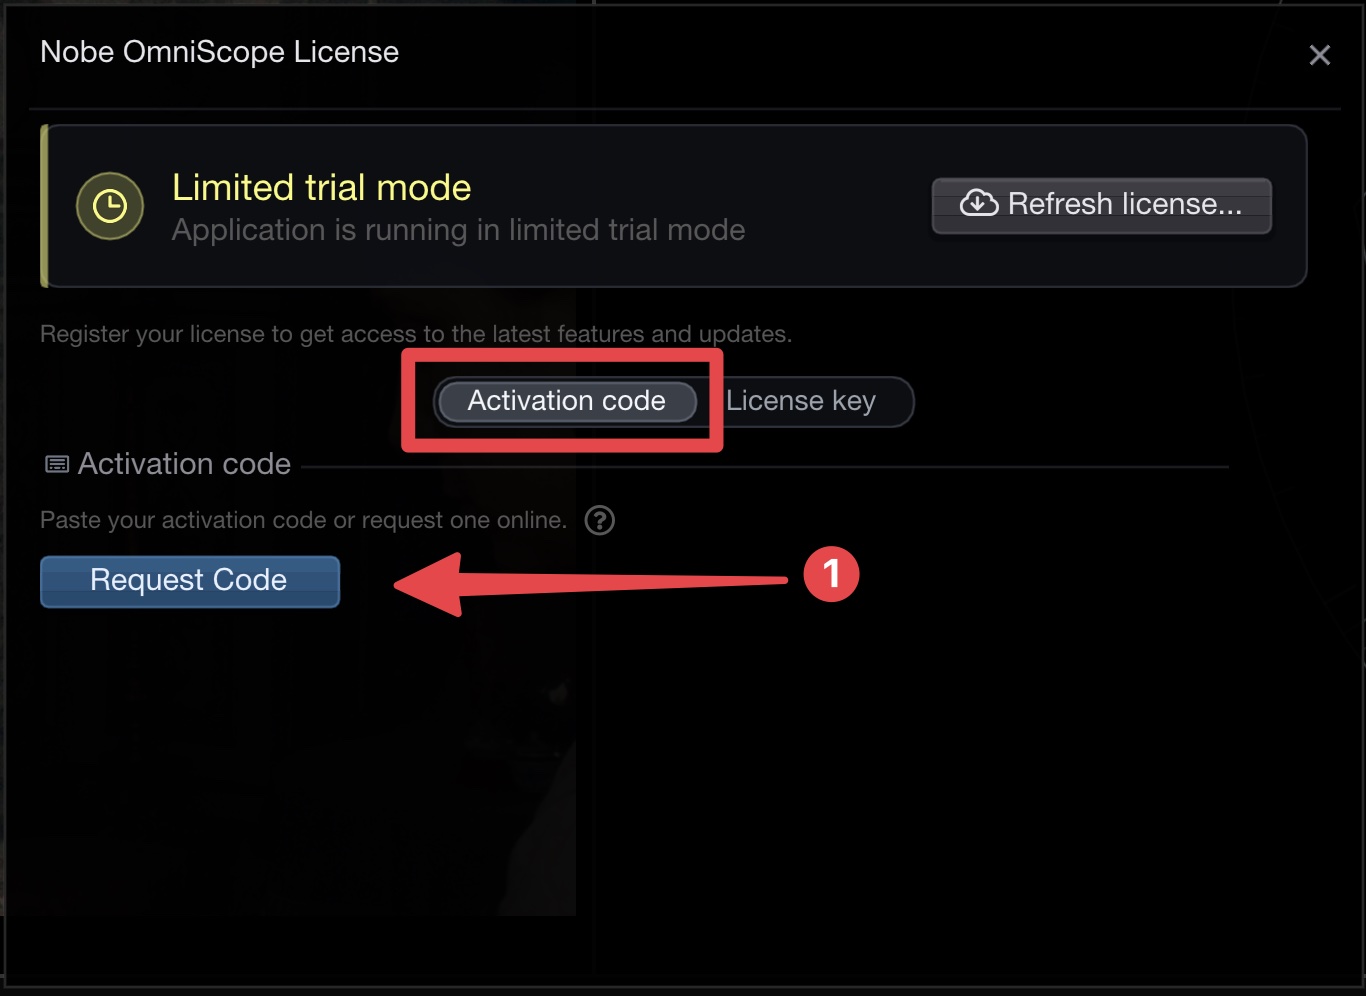
If direct License Key activation fails (due to connectivity problems, proxies, firewall, or antivirus blocking web requests), or you need to activate on an **offline system**, you can use the Activation Code method instead:

{% hint style="info" %}
On Windows, if direct License Key activation fails due to SSL/network inspection policies, use **Activation Code** flow below. It uses the browser-based activation page and works reliably in restricted environments.
{% endhint %}

{% hint style="info" %}
Activation Code still uses the machine Hardware ID under the hood. The Machine Name shown in the app or on the website is only a friendly label to help identify the activation later.
{% endhint %}

<figure><img src="https://565437294-files.gitbook.io/~/files/v0/b/gitbook-x-prod.appspot.com/o/spaces%2F-MFqn5MuayPgQPMZ9pwf%2Fuploads%2Fgit-blob-57e118649f0f49deef58528faf76985598e8a018%2F2026-02_activation_code.jpg?alt=media" alt=""><figcaption><p>Activation Code</p></figcaption></figure>

Click **Request Code** to open the activation page in your web browser:

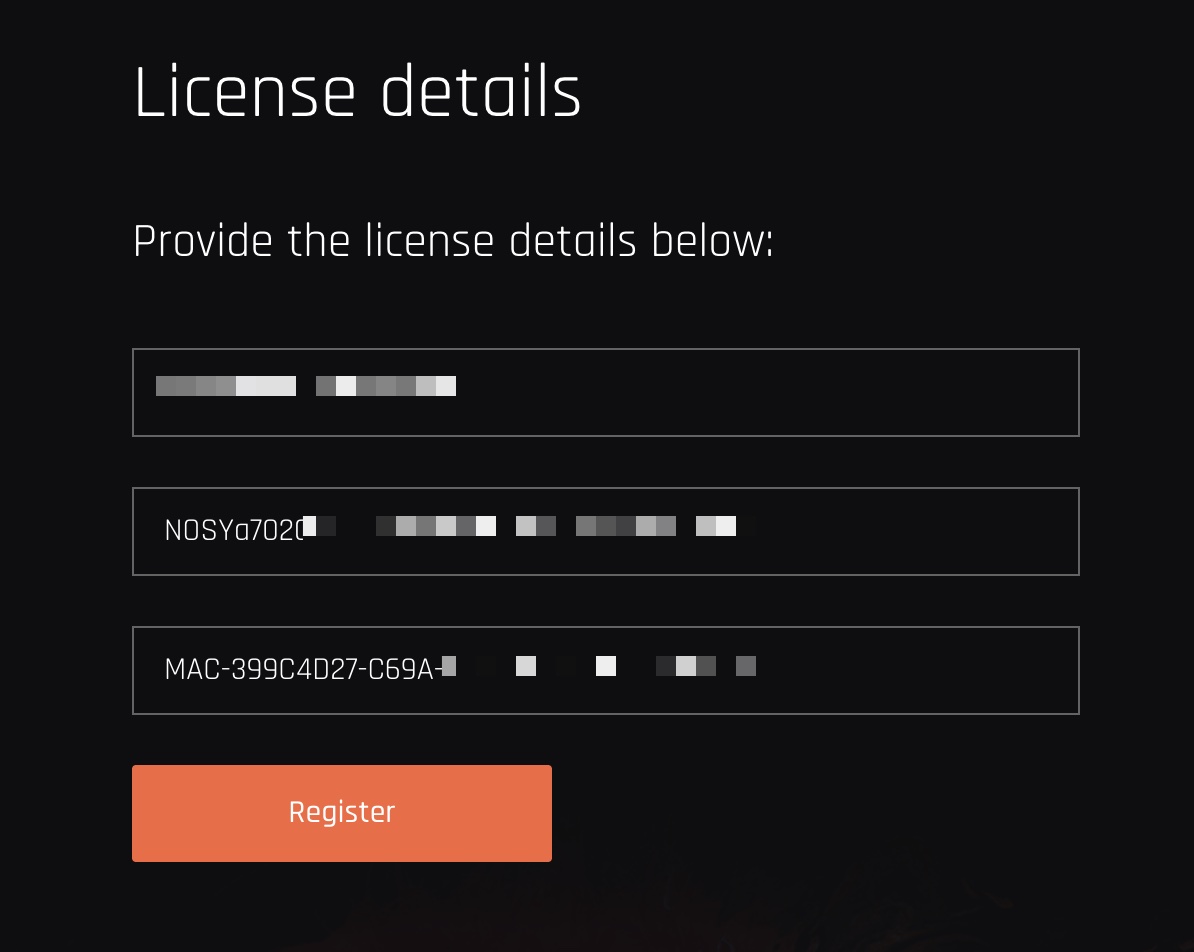
<figure><img src="https://565437294-files.gitbook.io/~/files/v0/b/gitbook-x-prod.appspot.com/o/spaces%2F-MFqn5MuayPgQPMZ9pwf%2Fuploads%2Fgit-blob-be80ed601a97bcf604b8e12cbaa5e42bc7aa47f4%2F2026-02_request_code.jpg?alt=media" alt=""><figcaption><p>Fill in your license details</p></figcaption></figure>

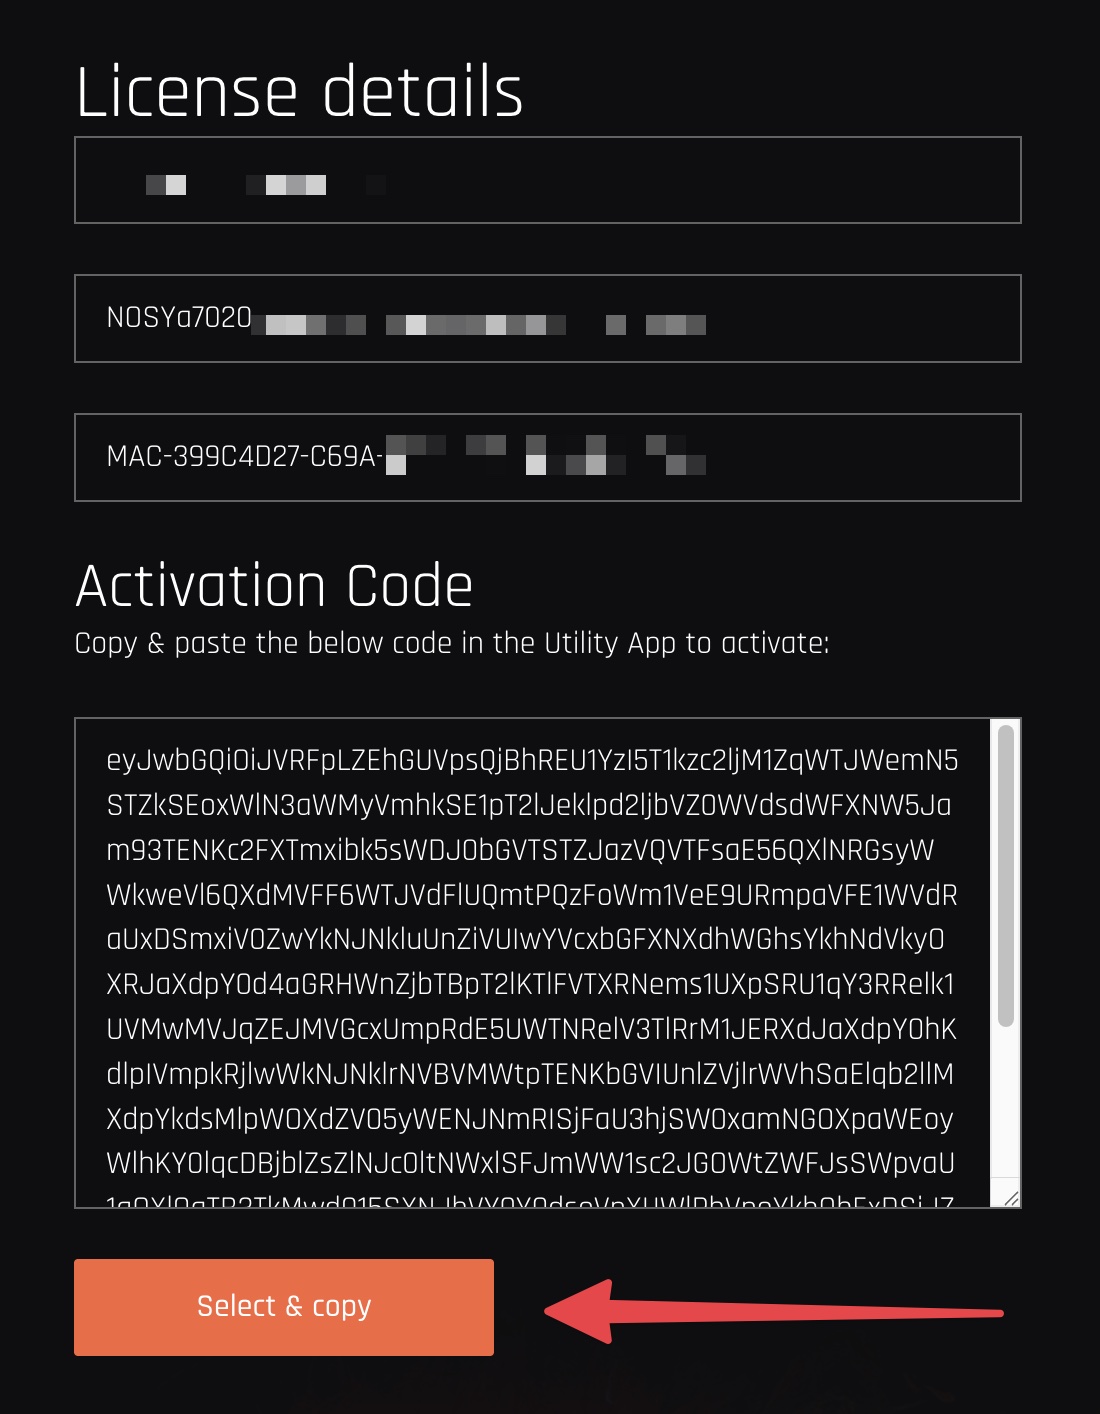
Fill in your license details and press **Submit**. You will receive your **Activation Code**:

<figure><img src="https://565437294-files.gitbook.io/~/files/v0/b/gitbook-x-prod.appspot.com/o/spaces%2F-MFqn5MuayPgQPMZ9pwf%2Fuploads%2Fgit-blob-373c94adb61ca81534fb4e1537f379ef8b185d79%2F2026-02_copy_code.jpg?alt=media" alt=""><figcaption><p>Activation code</p></figcaption></figure>

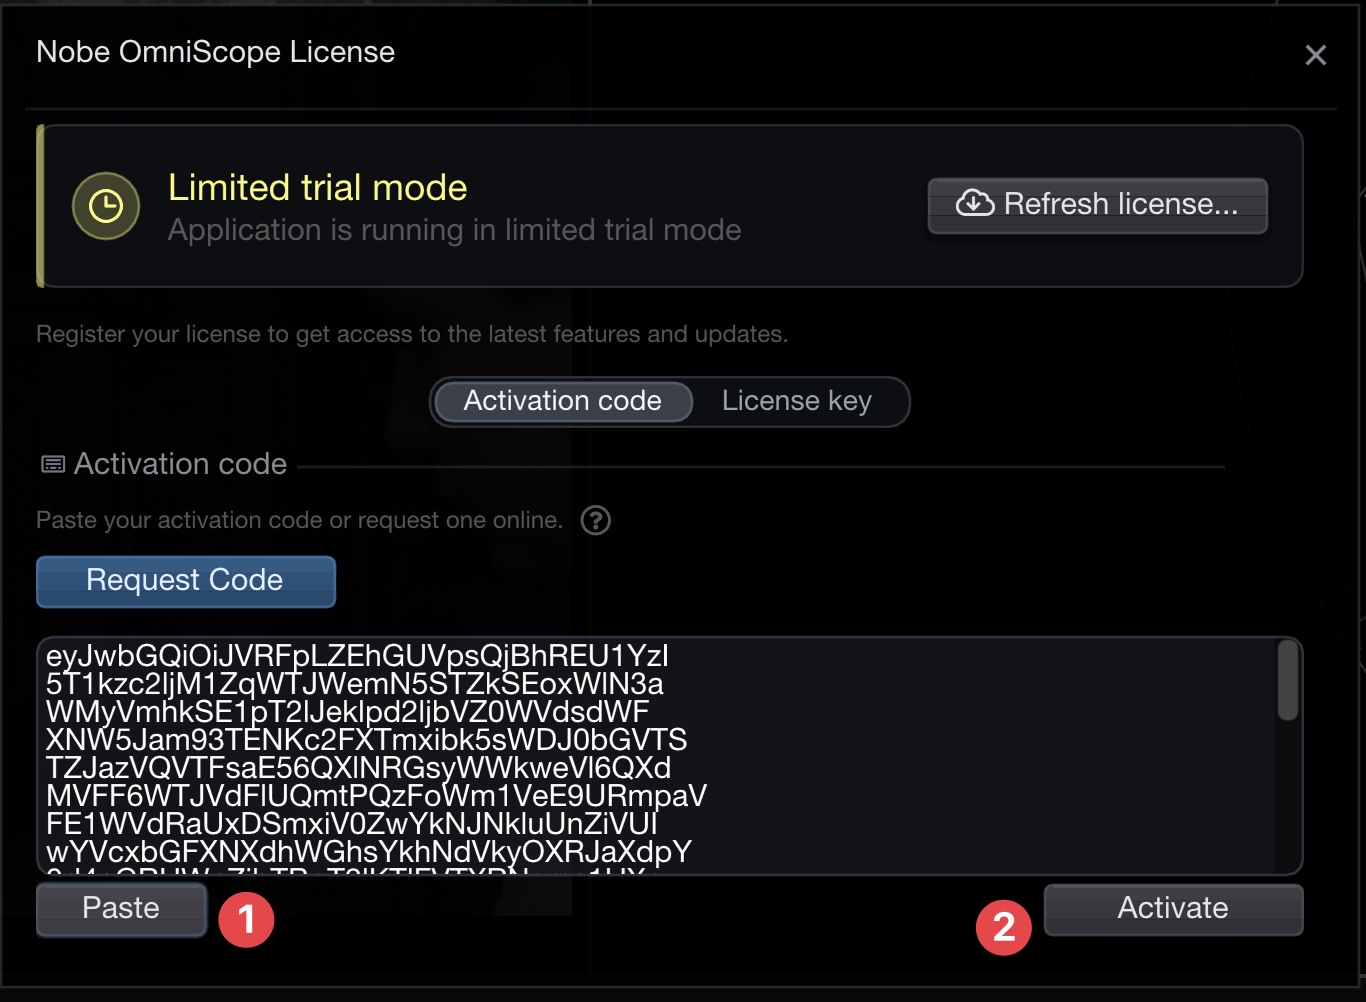
Copy & paste the code back in OmniScope to finish the registration process:

<figure><img src="https://565437294-files.gitbook.io/~/files/v0/b/gitbook-x-prod.appspot.com/o/spaces%2F-MFqn5MuayPgQPMZ9pwf%2Fuploads%2Fgit-blob-cffe141680e92c070dd9e4be7dcada94f576547d%2F2026-02_activation_code_activate.jpg?alt=media" alt=""><figcaption><p>Activate with code</p></figcaption></figure>


# Offline activation

How to activate the license without internet access on the destination system

If the machine running OmniScope has no internet access, you can still activate it using the built‑in **Offline activation** workflow: request an activation file on a second, internet‑connected device (a phone is enough) and import it back into OmniScope.

## Prerequisites

The license still needs to be validated online, so you will need a separate device (computer, tablet, or smartphone) with **internet access** and a **web browser**. You also need a way to move a small file (or a copied URL) between the two devices.

## Steps

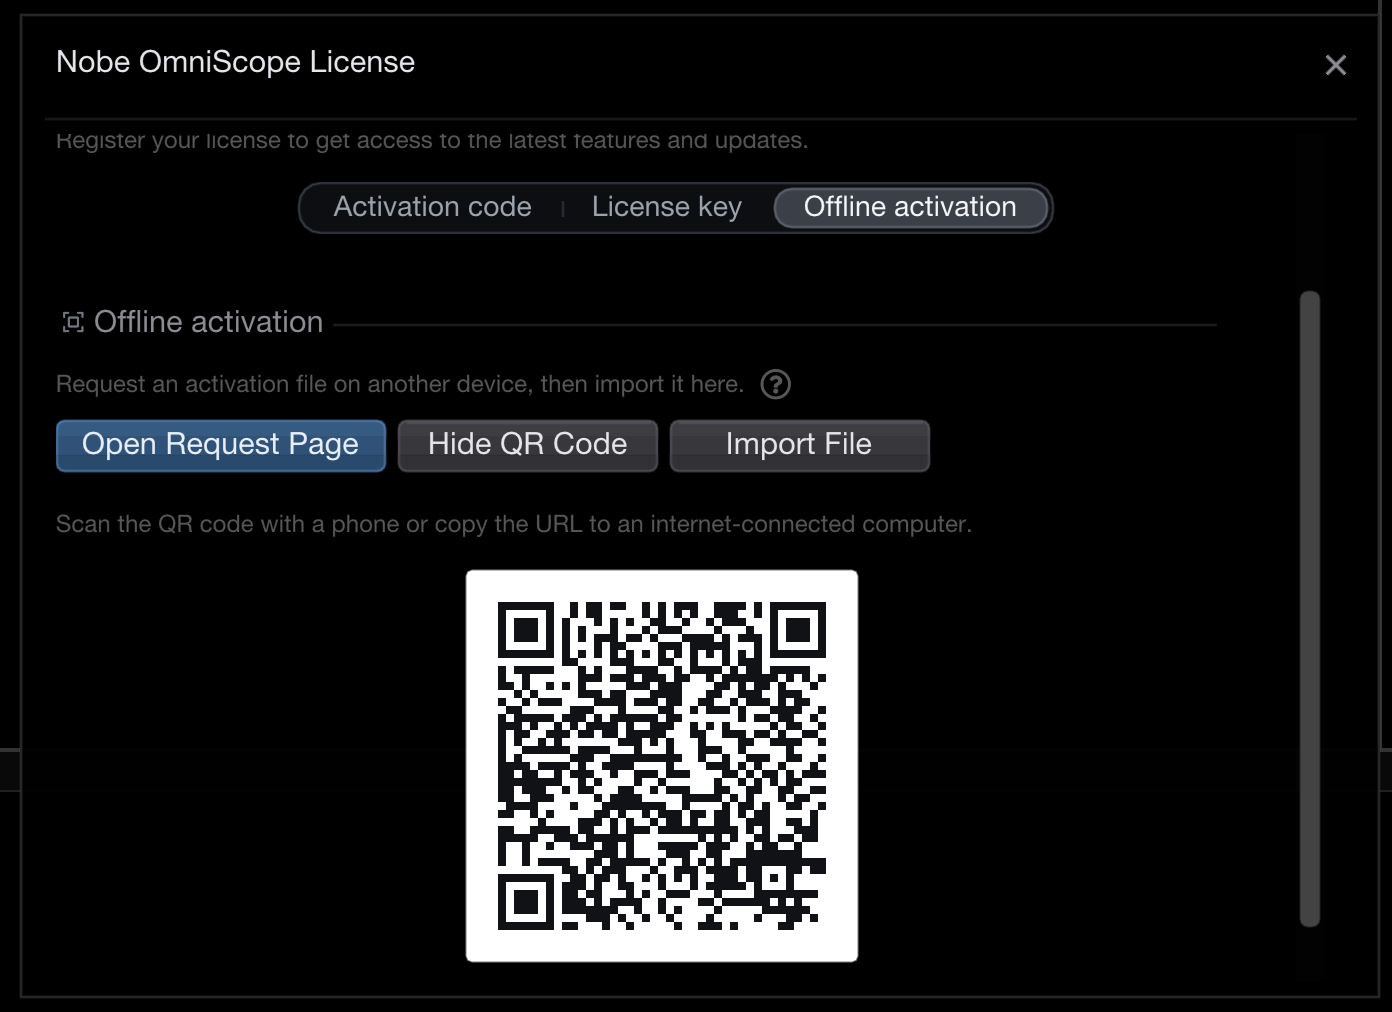
On your offline system, open OmniScope and go to **License / Register**, then select the **Offline activation** tab.

<figure><img src="https://565437294-files.gitbook.io/~/files/v0/b/gitbook-x-prod.appspot.com/o/spaces%2F-MFqn5MuayPgQPMZ9pwf%2Fuploads%2Fgit-blob-961d8e1a5130f20ae3fb91e2126bfa929c4aa024%2F2026-06_offline_activation_tab.png?alt=media" alt="Offline activation tab with Open Request Page, QR code, and Import File buttons"><figcaption><p>The Offline activation tab</p></figcaption></figure>

The request page already includes this machine's **Hardware ID**, so there is nothing to copy by hand. Open it on your internet‑connected device in one of these ways:

* **Show QR Code** – scan the QR code with your phone's camera to open the request page directly.
* **Copy URL** – copy the request URL and paste it into a browser on any internet‑connected computer.
* **Open Request Page** – open the page in a browser on the current machine (useful if it has limited or proxied internet access).

On the request page, enter your **Email address** and **License key**, then download the **activation file**.

Transfer the activation file to your offline system (USB drive, network share, etc.), return to the **Offline activation** tab, and click **Import File**. Select the downloaded file.

The downloaded activation file is tied to the **Hardware ID** embedded in that request. Generate it from the same OmniScope machine that will import it; a file requested for a different system will not activate this one.

OmniScope validates the file and, once accepted, activates the license and restarts. Your offline system is now fully activated.

{% hint style="info" %}
Once that machine is later visible on the website, it may show a friendly **Machine Name** to make it easier to identify among your activations. The Machine Name is only a label and is never used in place of the Hardware ID.
{% endhint %}

## Alternative: activation code

You can also activate offline by pasting a text **activation code** instead of importing a file. On your internet‑connected device, open the activation page:

<https://timeinpixels.com/activate/>

<figure><img src="https://565437294-files.gitbook.io/~/files/v0/b/gitbook-x-prod.appspot.com/o/spaces%2F-MFqn5MuayPgQPMZ9pwf%2Fuploads%2Fvw9fXpSIFz1VIhEUR43i%2FCleanShot%202023-11-16%20at%2014.48.52%402x.png?alt=media&amp;token=3ae78700-54b7-4ac5-9a7c-e207f522159f" alt=""><figcaption><p>Activate the license</p></figcaption></figure>

Fill in your **Email address**, **License Key**, and the **Hardware ID** of the offline machine (expand the **Hardware ID** section in OmniScope's **About** window to copy it), then click **Submit**.

<figure><img src="https://565437294-files.gitbook.io/~/files/v0/b/gitbook-x-prod.appspot.com/o/spaces%2F-MFqn5MuayPgQPMZ9pwf%2Fuploads%2FDneO166tvpwUbZAUDTgw%2FCleanShot%202023-11-16%20at%2014.52.36%402x.png?alt=media&amp;token=40570a49-c422-4481-b33c-ac3f94205c42" alt=""><figcaption></figcaption></figure>

Transfer the generated **Activation Code** to your offline system, open the **Activation code** tab in **License / Register**, paste the code, and click **Activate**.

<figure><img src="https://565437294-files.gitbook.io/~/files/v0/b/gitbook-x-prod.appspot.com/o/spaces%2F-MFqn5MuayPgQPMZ9pwf%2Fuploads%2Fgit-blob-cffe141680e92c070dd9e4be7dcada94f576547d%2F2026-02_activation_code_activate.jpg?alt=media" alt=""><figcaption><p>Activate the code</p></figcaption></figure>


# Coupon codes

How to apply a coupon code

Coupon codes can be applied during checkout using a small button **Add Coupon** (see below):

![](https://565437294-files.gitbook.io/~/files/v0/b/gitbook-x-prod.appspot.com/o/spaces%2F-MFqn5MuayPgQPMZ9pwf%2Fuploads%2Ff9zDDrP0iDsfnMGpSFT5%2Fpaddle_coupon.png?alt=media\&token=143c8b27-d159-495b-82e6-77dca0be2ffa)


# OB and live broadcast monitoring

Set up Nobe OmniScope for SDI monitoring, camera shading and camera matching in OB trucks, studios and flypacks.

Use Nobe OmniScope as a software scope station for camera shading and camera matching in outside broadcast (OB) trucks and vans, studios, and flypack systems. Keep the selected camera picture, waveform and vectorscope together in a layout suited to your production.

This guide covers a practical SDI monitoring workflow. Start with [system requirements](/nobe-omniscope/requirements) and qualify your computer, capture hardware, drivers and signal format together before using the station on a show.

## Connect an SDI feed

1. Route the camera, router or production switcher output you want to inspect to a supported capture device on the OmniScope computer. See [DeckLink and UltraStudio](/nobe-omniscope/sources/decklink-and-ultrastudio), [AJA](/nobe-omniscope/sources/aja) or [DeltaCast](/nobe-omniscope/sources/deltacast) for setup details.
2. Open **Input > Connect to...** and select the capture source. Confirm that the picture is the intended feed and the capture device supports the incoming format.
3. Check the input's [signal range](/nobe-omniscope/sources/decklink-and-ultrastudio/signal-range) against the upstream source. Confirm how your scopes display Video or Full range before judging levels.

A [dedicated scope computer](/nobe-omniscope/sources/decklink-and-ultrastudio/dedicated-scope-pc) needs a capture input for an existing SDI feed. The separate output device described in that guide is needed when sending a signal from a grading computer; it is not an extra requirement when your camera or router already provides SDI.

## Build a camera shading layout

Combine the picture with a [waveform](/nobe-omniscope/scopes/waveform) for exposure and channel balance, and a [vectorscope](/nobe-omniscope/scopes/vectorscope) for color comparisons. Save the arrangement as a [layout](/nobe-omniscope/layouts) for the next production. Use consistent source settings and scope scales when comparing cameras.

For several connected feeds, enable **View > Input Strip**. Assign each scope to its intended source using the scope's **Input Device** menu. The [multiple input sources guide](/nobe-omniscope/sources/multiple-input-sources) explains assignment and the color-coded source indicators. Verify these assignments after changing the layout or routing.

## Compare cameras with a reference

Capture a [snapshot](/nobe-omniscope/scopes/snapshot) of your reference camera to compare exposure, neutral balance and color while adjusting another camera. Use a comparable scene, lighting and framing so differences in the picture do not obscure the comparison.

With [Live Pack](/nobe-omniscope/live-pack-add-on), you can also use a [snapshot as a source](/nobe-omniscope/live-pack-add-on/snapshot-as-source) or arrange feeds in a [composite input](/nobe-omniscope/live-pack-add-on/composite-input). A composite overview is useful for orientation; keep individual scope assignments clear when judging a particular camera.

## Choose the tools your production needs

OmniScope provides the scope workspace and supported input sources. Live Pack is an add-on for **OmniScope Pro** that adds tools such as composite views, SDI output, recording, focus peaking and loudness metering. See the [Live Pack overview](/nobe-omniscope/live-pack-add-on) for the available features and license options.

For an SDR/HDR setup, establish the incoming signal, any transforms and the intended measurement point before comparing readings. The [HDR and SDR monitoring example](/nobe-omniscope/sources/decklink-and-ultrastudio/hdr-and-sdr-monitoring-with-decklink-8k-pro) describes one hardware configuration.

## Check the station before a show

* Confirm the incoming format, signal range, scope scales and source assignments with known test material.
* Exercise the router or switcher changes you expect during production. Check picture recovery and source identification after a feed change or interruption.
* Run the intended inputs, scopes, recording and outputs together for a representative session. Check responsiveness and end-to-end delay on the actual hardware.
* Review the [live processing rate](/nobe-omniscope/sources#live-processing-rate). In OmniScope 1.11.55 and later, adaptive or reduced analysis rates can omit frames; live QC and recordings use the sampled video. Use file analysis when every frame must be checked.
* Verify [license activation](/nobe-omniscope/license/license-activation), including [offline activation](/nobe-omniscope/license/offline-activation) if the production computer will not have internet access.

Keep the tested hardware, driver versions, signal formats and saved layout with your production setup notes so the station can be reproduced.


# Sources

Connect SDI capture devices, network feeds and software sources for video scope monitoring.

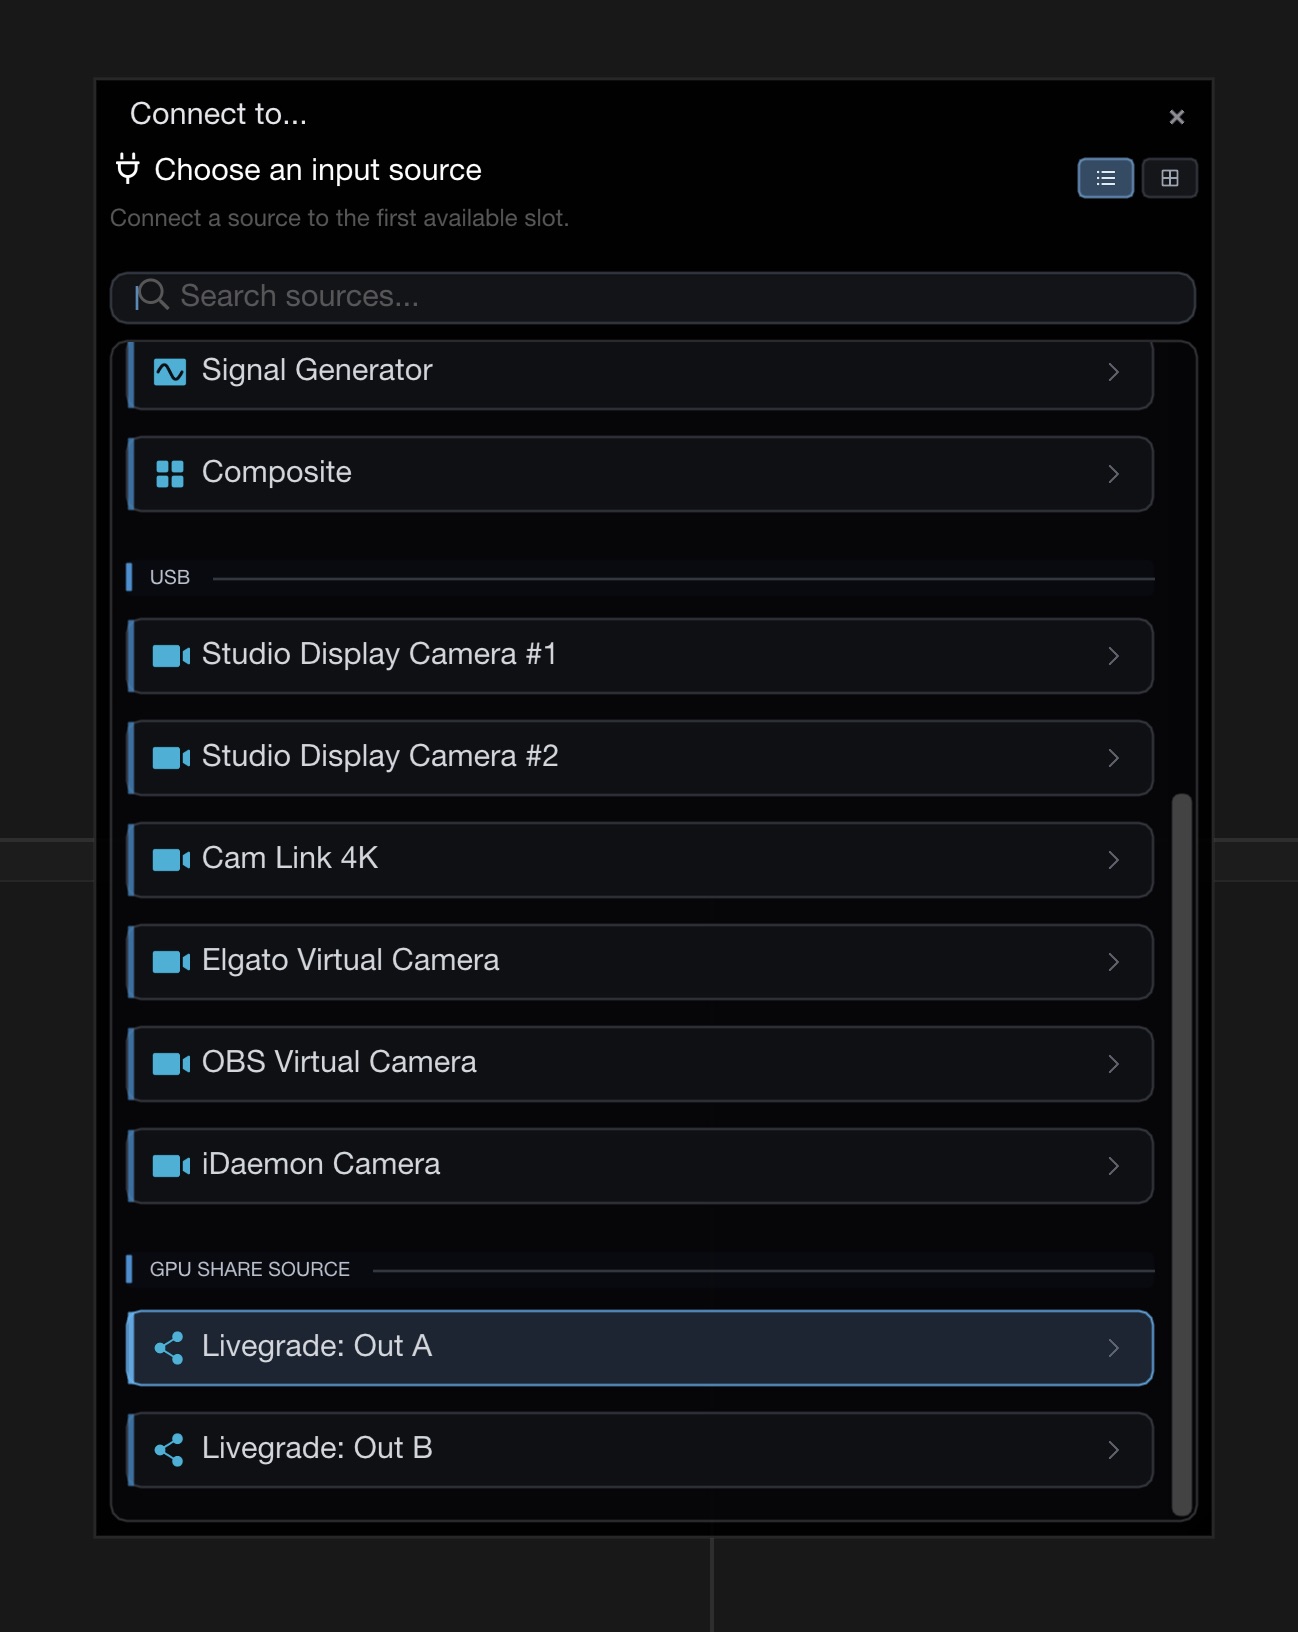
OmniScope supports a wide range of input sources. Use the **Connect to** dialog (**Input > Connect to...**) to browse and connect available sources.

Hardware I/O sources documented here include **DeckLink / UltraStudio**, **AJA**, and **DeltaCast** SDI capture devices, alongside software and network inputs such as NDI, OFX, SRT, FFmpeg, and file-based sources.

For camera shading in OB trucks, studios and flypacks, see [OB and live broadcast monitoring](/nobe-omniscope/outside-broadcast) for source setup, camera matching and pre-show checks.

## Live Processing Rate

In OmniScope 1.11.55 and later, live sources provide an **Analysis rate** setting under **Input Settings > Common > Live processing**. The default **Adaptive (60 / 30 / 15 fps)** mode favors the newest frame and lowers the analysis rate when the system is under load, then raises it again when performance recovers. The input signal format and source frame rate are unchanged.

You can also choose:

* **Source rate - low latency**
* **30 fps maximum**
* **15 fps maximum**
* **Buffered (previous behavior)**

{% hint style="warning" %}
QC checks and recordings use the sampled video from a live source. A lower or adaptive analysis rate can miss brief events; use file analysis when every frame must be checked.
{% endhint %}

## Favourite Sources

{% hint style="info" %}
Available in version **1.11.37+**
{% endhint %}

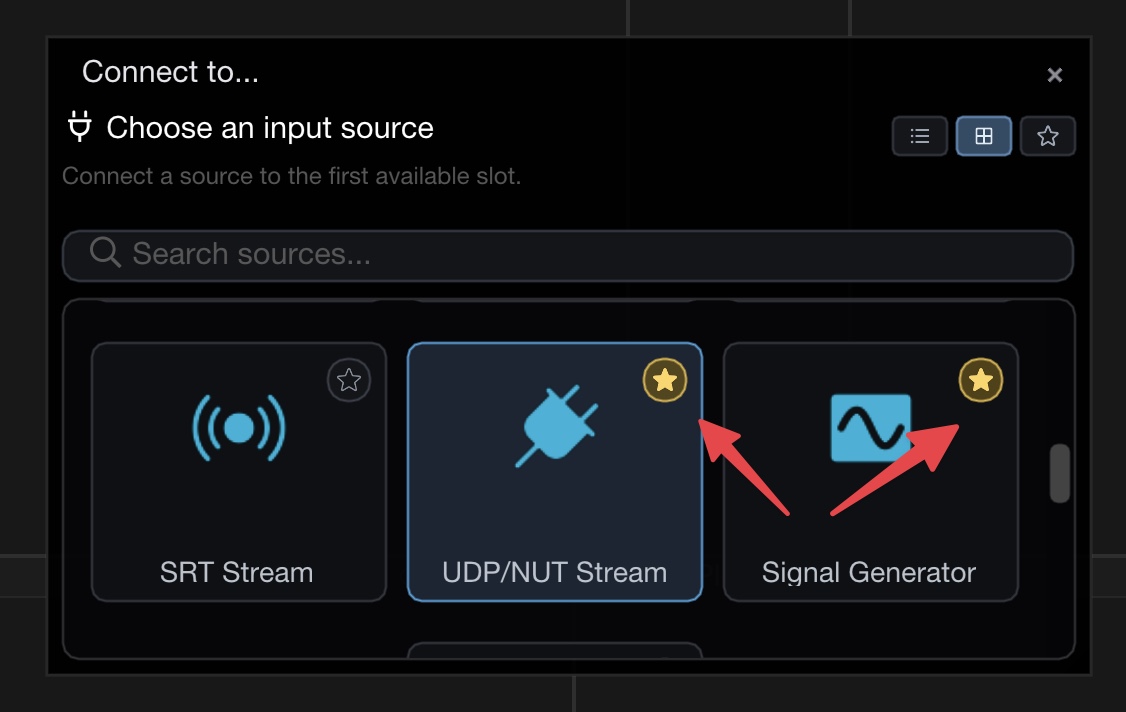
You can mark frequently used sources as favourites for quick access. Click the star icon on any source in the **Connect to** dialog to add it to your favourites. Favourited sources are highlighted with a golden star.

<figure><img src="https://565437294-files.gitbook.io/~/files/v0/b/gitbook-x-prod.appspot.com/o/spaces%2F-MFqn5MuayPgQPMZ9pwf%2Fuploads%2Fgit-blob-e945cc83fc6c2d0334be4d2ab5e0cef9a3831ff2%2F2026-03_connect-dialog-favourites-1.jpg?alt=media" alt=""><figcaption><p>Star icon on source tiles to mark favourites</p></figcaption></figure>

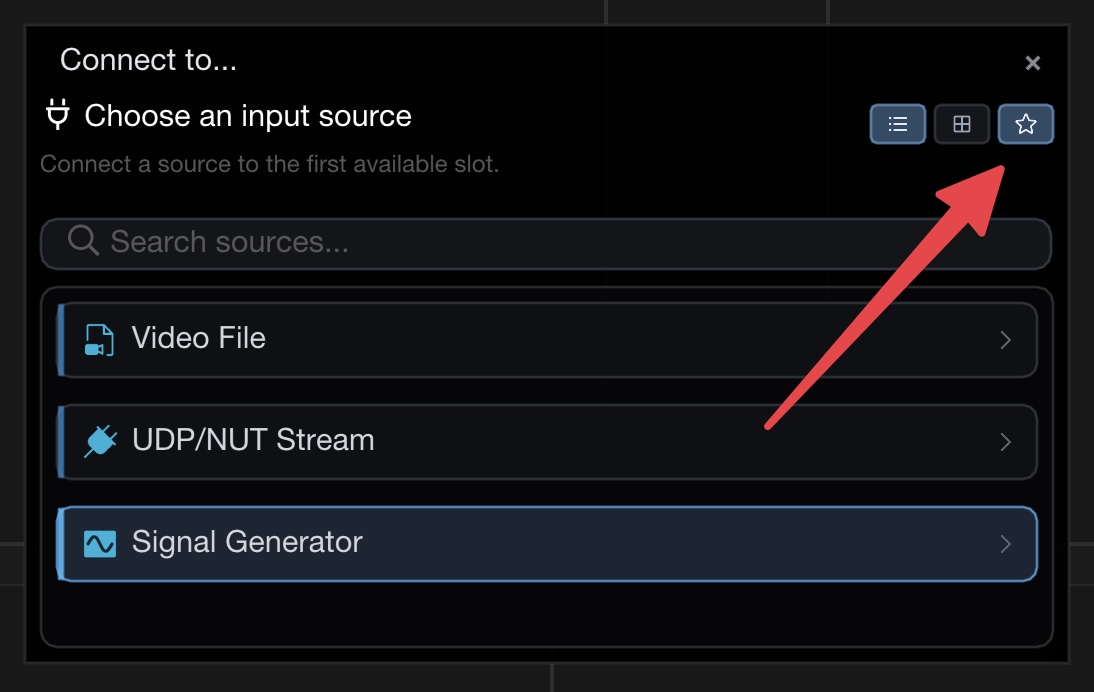
Use the star toggle button in the top-right corner of the dialog (next to list/tile view buttons) to filter the list and show only your favourite sources. This is especially useful when you have many sources available and want to quickly connect to the ones you use most often.

<figure><img src="https://565437294-files.gitbook.io/~/files/v0/b/gitbook-x-prod.appspot.com/o/spaces%2F-MFqn5MuayPgQPMZ9pwf%2Fuploads%2Fgit-blob-8a21ef29fe4e072e4fcde1bdf31832f88b551ce0%2F2026-03_connect-dialog-favourites-2.jpg?alt=media" alt=""><figcaption><p>Star filter button shows only favourite sources</p></figcaption></figure>

Favourites and the filter state are remembered across sessions.


# DeckLink & UltraStudio

Nobe OmniScope supports any BlackMagic input card. It will be detected automatically and displayed in the “Connect to…” dialog box.

OmniScope requires **DesktopVideo 10.10 or later**.

Supported input-device examples include **UltraStudio Mini Recorder 12G**, **UltraStudio Recorder 3G**, **UltraStudio 4K Mini**, **DeckLink Mini Recorder 4K**, **DeckLink Recorder 4K**, **DeckLink 4K Extreme**, and **DeckLink 8K Pro**. For newer Blackmagic Design hardware, install the latest Blackmagic Desktop Video driver first.

For a standalone OmniScope machine on Thunderbolt, the **UltraStudio Mini Recorder 12G** is our default recommendation — it captures up to UHD 2160p60 over 12G-SDI and is the most cost-effective capture device for the job. See [Dedicated Scope PC](/nobe-omniscope/sources/decklink-and-ultrastudio/dedicated-scope-pc).

### Checking the current device status

You can check the device in Help / DeckLink window:

![](https://565437294-files.gitbook.io/~/files/v0/b/gitbook-legacy-files/o/assets%2F-MFqn5MuayPgQPMZ9pwf%2F-MHjfKjAwUcEGmV2I7df%2F-MHjfs63xz5IQdI9KzyJ%2Fos_decklink_status.png?alt=media\&token=7a9b50bf-1270-4d24-be75-2a859f1652e6)

### DeckLink Unavailable Message

If OmniScope cannot access a DeckLink device at startup (for example, the device is in use by another application or the driver is not loaded), the input source will display a clear **"DeckLink unavailable"** status message instead of a blank or generic error. Check that no other application is capturing from the same device, then reconnect the source.

OmniScope also handles the case where a DeckLink device reports no name string — device enumeration will complete normally instead of crashing, and the device will still appear in the source list.

### REC Badge

When a supported DeckLink or UltraStudio source is actively recording, OmniScope shows a **REC** badge on the input tile. Recording state is detected from supported input metadata. This gives you a quick visual confirmation that recording is in progress without needing to open any additional windows.

### Pass-Through and Feedback Flashes

On cards such as the DeckLink 8K Pro that use Desktop Video-managed port profiles, OmniScope correctly preserves the profile on connect and disconnect. If you experienced SDI/HDMI feedback flashes on disconnect or app exit, this was fixed in version 1.11.39.

### Diagnostics View (1.11.19+)

Open Input Settings for a DeckLink or UltraStudio source and select **Diagnostics** to see live signal and device health (format, link, queue state). Use this view when troubleshooting capture stability or pass-through issues.


# Dedicated Scope PC

Set up a dedicated scope computer for grading suites, SDI camera shading and outside broadcast monitoring.

OmniScope software can be used on a dedicated machine.

When monitoring the output of a separate grading computer, you will need **2 I/O devices**. The **output device** should be connected to your DaVinci Resolve system to send the SDI/HDMI signal to the other system.

On the second system you will need an **input device** to receive the SDI/HDMI signal.

For an existing SDI feed from a camera, router or production switcher, connect that feed directly to a supported capture input on the scope computer. See [OB and live broadcast monitoring](/nobe-omniscope/outside-broadcast) for a camera shading workflow in an OB truck or flypack.

## PC with a PCIe card

On a desktop PC with PCIe slots, install a DeckLink **output card** in your grading system and a DeckLink **input card** in the dedicated scope PC.

Please see the below diagram:

![](https://565437294-files.gitbook.io/~/files/v0/b/gitbook-legacy-files/o/assets%2F-MFqn5MuayPgQPMZ9pwf%2F-MYdOa5Zqbd9Wg7_bXgT%2F-MYd_gxppghchWMSWZ5k%2Fexternal_box.png?alt=media\&token=823e754c-ee98-46a5-a5c6-94550f1cb6fc)

You could also use multi-I/O cards, just make sure to have an SDI/HDMI in and outs as described above.

## Mac Mini with Thunderbolt

Modern Macs no longer offer PCIe expansion, but you can build the same setup with external Thunderbolt capture devices. A Mac Mini makes an excellent compact dedicated scope machine:

1. **Grading system** — connect an **UltraStudio 4K Mini** (or another Blackmagic Design output device) and send the signal out via SDI.
2. **Scope Mac** — receive the SDI signal with a Thunderbolt capture device connected to the Mac Mini running OmniScope:
   * **UltraStudio Mini Recorder 12G** — **recommended**. Captures UHD up to 2160p60 over 12G-SDI and is the most cost-effective capture device for a dedicated scope machine.
   * **UltraStudio Recorder 3G** — budget HD-only option, up to 1080p60
   * A second **UltraStudio 4K Mini** — if you also need SDI/HDMI output from the scope Mac
3. Connect your GUI monitor to the Mac Mini as a normal desktop display.

Please see the below diagram:

![](https://565437294-files.gitbook.io/~/files/v0/b/gitbook-x-prod.appspot.com/o/spaces%2F-MFqn5MuayPgQPMZ9pwf%2Fuploads%2Fgit-blob-bd7cfa1b55b8c9a3c8ec0b0f63dba026f13cd993%2Fmac_mini_thunderbolt.png?alt=media)

{% hint style="success" %}
**Recommended:** the **UltraStudio Mini Recorder 12G** is the default choice for a dedicated scope Mac. It's an input-only Thunderbolt device, handles everything up to UHD 2160p60, and costs considerably less than a second UltraStudio 4K Mini — which you'd otherwise buy only to use its input. Install the latest Blackmagic Desktop Video driver, then select it in OmniScope under **Connect To**.
{% endhint %}

{% hint style="info" %}
**Resolution caveat:** the UltraStudio Recorder 3G has a 3G-SDI input only, so it cannot capture UHD signals. If you need to monitor UHD (up to 2160p60), use an UltraStudio Mini Recorder 12G or another 12G-SDI capable capture device on the scope Mac.
{% endhint %}


# Monitoring on the same PC

Using OmniScope on the same computer as your NLE/Suite

OmniScope can be used on the same system as your DaVinci Resolve installation without using the OFX plugin but rather through SDI/HDMI signal.

This can be achieved by looping the SDI/HDMI signal back to the same computer so that the signal is visible to Nobe OmniScope.

To make it work you will need 2 I/O cards (or 1 multi I/O card - see below):

1. Output card - to send the signal out of DaVinci Resolve
2. Input card - to receive the signal back in Nobe OmniScope

Both cards should be looped with SDI or HDMI cable - see the diagram below:

![Looping the SDI signal with DeckLink PCIe card](https://565437294-files.gitbook.io/~/files/v0/b/gitbook-legacy-files/o/assets%2F-MFqn5MuayPgQPMZ9pwf%2F-MYdaByaalItf0E1ePL5%2F-MYdajUToIF1DPYlpeXp%2Fsame_pc.png?alt=media\&token=876eb3bd-32f3-4a5b-8042-1259f755c715)

Here's the diagram with UltraStudio ThunderBolt 3 card(s):

![Looping the SDI signal with UltraStudio ThunderBolt card(s)](https://565437294-files.gitbook.io/~/files/v0/b/gitbook-legacy-files/o/assets%2F-MFqn5MuayPgQPMZ9pwf%2F-MYdaByaalItf0E1ePL5%2F-MYdauzmNbK1ZrAk6KtT%2Fsame_pc_ultrastudio.png?alt=media\&token=9d8f3153-e48a-4dc1-967a-8943780bb6f9)

### Supported Hardware

Nobe OmniScope supports all the compatible DeckLink and UltraStudio devices.


# DeckLink 4K 12G Extreme Monitoring

How to monitor on the same machine using DeckLink 4K 12G Extreme

It is possible to use DeckLink 4K 12G Extreme to send the signal to the reference monitor and monitor the signal in OmniScope on the same machine as Resolve.

Here's the back of the card with the cables plugged in:

<figure><img src="https://565437294-files.gitbook.io/~/files/v0/b/gitbook-x-prod.appspot.com/o/spaces%2F-MFqn5MuayPgQPMZ9pwf%2Fuploads%2FNRk4vAUwxUWuquFX81kQ%2Fimage.png?alt=media&amp;token=f86f03bb-c57c-4f54-a79d-3dcdac584be8" alt=""><figcaption></figcaption></figure>


# DeckLink 8K Pro monitoring

How to monitor on the same PC with DeckLink 8K Pro

Here's a quick setup that allows you to monitor a signal with OmniScope on the same PC as DaVinci Resolve.

### Desktop Video setup

Make sure to set the connectors to SDI 1 in, SDI 2 Out:

![](https://565437294-files.gitbook.io/~/files/v0/b/gitbook-x-prod.appspot.com/o/spaces%2F-MFqn5MuayPgQPMZ9pwf%2Fuploads%2F6puiSF1ilgloVVVK1vCi%2FCleanShot%202022-06-02%20at%2012.21.17%402x.png?alt=media\&token=4ad42f95-8454-450c-baac-c80310398945)

### DaVinci Resolve configuration

Set the Monitor device in Video and Audio I/O section in DaVinci Resolve to DeckLink 8K Pro (2):

![](https://565437294-files.gitbook.io/~/files/v0/b/gitbook-x-prod.appspot.com/o/spaces%2F-MFqn5MuayPgQPMZ9pwf%2Fuploads%2FV88Dda8Bms8QBg7NflGO%2FCleanShot%202022-06-02%20at%2011.47.26%402x.png?alt=media\&token=45deb1d3-3afc-4ee2-b18e-d827b7099f71)

### Looping back the ports

Here's how you should loop back the ports with the SDI cable:

![](https://565437294-files.gitbook.io/~/files/v0/b/gitbook-x-prod.appspot.com/o/spaces%2F-MFqn5MuayPgQPMZ9pwf%2Fuploads%2FvRxFLgzZh2fzZW4nDWiV%2FCleanShot%202022-06-02%20at%2011.50.27%402x.png?alt=media\&token=4ba8d22e-346a-4640-bb9e-63c0b6c47aa0)

### OmniScope configuration

Then simply select DeckLink 8K Pro (1) as your input device in Connect To dialog in OmniScope. Make sure you are using DeckLink driver, not the USB driver:

![](https://565437294-files.gitbook.io/~/files/v0/b/gitbook-x-prod.appspot.com/o/spaces%2F-MFqn5MuayPgQPMZ9pwf%2Fuploads%2F0zh5F8Wak5XQHXJvgEDR%2FCleanShot%202022-06-02%20at%2011.48.06%402x.png?alt=media\&token=5dc2971e-40ee-4f20-aee9-5524d947acfe)


# UltraStudio 4K Mini monitoring

How to use OmniScope with UltraStudio 4K Mini and a reference monitor on the same Mac

If you're using the Blackmagic UltraStudio 4K Mini with HDMI out to a reference monitor and OmniScope shows no signal, the fix is a simple SDI loopback cable.

{% embed url="<https://youtu.be/c5vJ3VaNM8Y>" %}
Quick Tip: OmniScope + UltraStudio 4K Mini setup
{% endembed %}

## The Problem

The UltraStudio 4K Mini sends your video over HDMI to the reference monitor, but OmniScope needs an SDI signal to analyze the video. Without an SDI input, OmniScope has nothing to capture.

## The Solution

Connect a short SDI cable from the **SDI OUT** port back into the **SDI IN** port on the UltraStudio 4K Mini. This creates a loopback that feeds the same video signal back for OmniScope to capture.

## Signal Flow

The full signal path looks like this:

1. **Mac** sends video over **Thunderbolt** to the UltraStudio 4K Mini
2. **HDMI OUT** goes to the **reference monitor** (your monitoring stays exactly the same)
3. **SDI OUT** loops back into **SDI IN** via a short SDI cable
4. **OmniScope** captures the signal from the SDI input

You're simply adding a parallel path for scopes — your existing monitoring workflow is not affected.

## Setup Summary

| Connection     | From                | To                  |
| -------------- | ------------------- | ------------------- |
| Thunderbolt    | Mac                 | UltraStudio 4K Mini |
| HDMI           | UltraStudio 4K Mini | Reference Monitor   |
| SDI (loopback) | SDI OUT             | SDI IN              |

## OmniScope Configuration

Open OmniScope, go to **Connect To** and select the **UltraStudio 4K Mini** as your input device.

{% hint style="info" %}
That one SDI loopback cable is usually the missing piece when OmniScope shows no signal with the UltraStudio 4K Mini.
{% endhint %}


# DeckLink IP cards

DeckLink IP cards support for 2110 signal monitoring

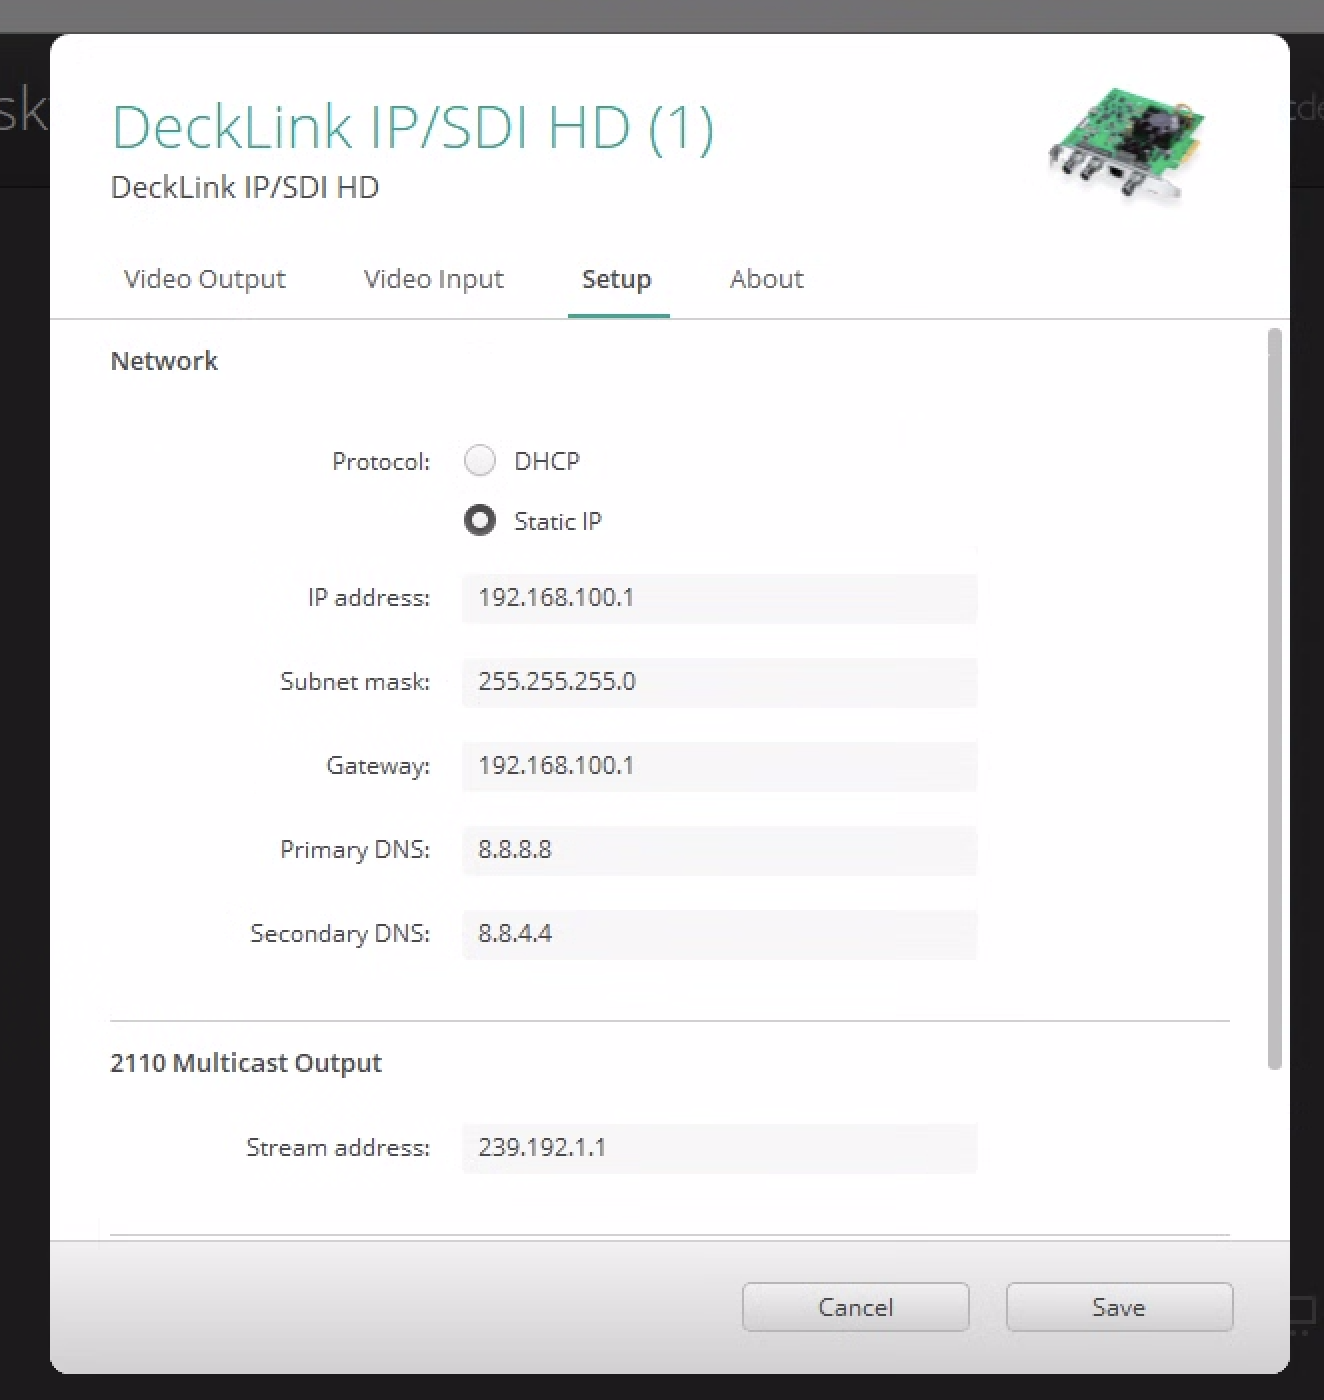
Nobe OmniScope supports DeckLink IP cards out of the box. The network configuration can be done in Desktop Video app and the devices will be auto-detected in the software on launch.

## DeckLink IP Cards - ST 2110 Video Streaming Guide

### Overview

DeckLink IP/SDI HD cards enable professional ST 2110 video streaming over standard Ethernet networks, allowing you to transmit uncompressed, high-quality video signals between systems without traditional SDI infrastructure. This technology is particularly valuable for remote production workflows, multi-room facilities, and flexible broadcast setups where running long SDI cables isn't practical.

### Key Advantages of IP-Based Video Streaming

**Network Flexibility**

* Stream video over existing Ethernet infrastructure
* Connect systems across different rooms or buildings
* Eliminate the need for expensive SDI cable runs
* Support for both direct connections and network switch configurations

**Professional Quality**

* Uncompressed 10-bit YCbCr video transmission
* Support for various broadcast formats (1080p, 4K, different frame rates)
* Low-latency streaming suitable for live production
* Simultaneous SDI and IP output capabilities

**Cost-Effective Scalability**

* Use standard Ethernet cables and switches
* Easier cable management compared to traditional SDI setups
* Future-proof solution compatible with modern IP-based workflows
* Reduced infrastructure costs for multi-location productions

### Common Use Cases

* **Remote Production**: Monitor video feeds from distant locations
* **Multi-Studio Facilities**: Share video signals between control rooms and studios
* **Live Streaming Workflows**: Integrate with software-based production tools like OmniScope
* **Backup and Redundancy**: Create IP-based backup paths for critical video signals
* **Hybrid Workflows**: Bridge traditional SDI equipment with modern IP-based systems

### Configuration Requirements

This guide demonstrates a working configuration for direct Ethernet connection between two DeckLink IP/SDI HD cards, covering the essential network settings, color space configuration, and troubleshooting steps needed for reliable ST 2110 streaming.

***

*The following configuration has been tested with DeckLink IP/SDI HD cards in a direct connection setup, successfully streaming 10-bit YCbCr video between DaVinci Resolve and monitoring applications.*

## Example configuration for simple DeckLink IP HD card setup

Assuming we have 2 machines equipped with DeckLink IP card connected via ethernet cable directly, here's the sender configuration:

<figure><img src="https://565437294-files.gitbook.io/~/files/v0/b/gitbook-x-prod.appspot.com/o/spaces%2F-MFqn5MuayPgQPMZ9pwf%2Fuploads%2FWl33g4WGwVjXFvxVKXQ9%2FCleanShot%202025-05-22%20at%2010.32.33%402x.png?alt=media&amp;token=f97f89e6-70cd-4a68-87d6-2e3e9c9511f6" alt=""><figcaption><p>Configuration on the sender side</p></figcaption></figure>

Here's the configuration on the receiving end:

<figure><img src="https://565437294-files.gitbook.io/~/files/v0/b/gitbook-x-prod.appspot.com/o/spaces%2F-MFqn5MuayPgQPMZ9pwf%2Fuploads%2Fp6M9erRlIm3NvPaiB3KH%2FCleanShot%202025-05-22%20at%2010.32.41%402x.png?alt=media&amp;token=a2f7fae8-f355-46ab-a134-56501ce8c410" alt=""><figcaption><p>Configuration on the receiver side</p></figcaption></figure>

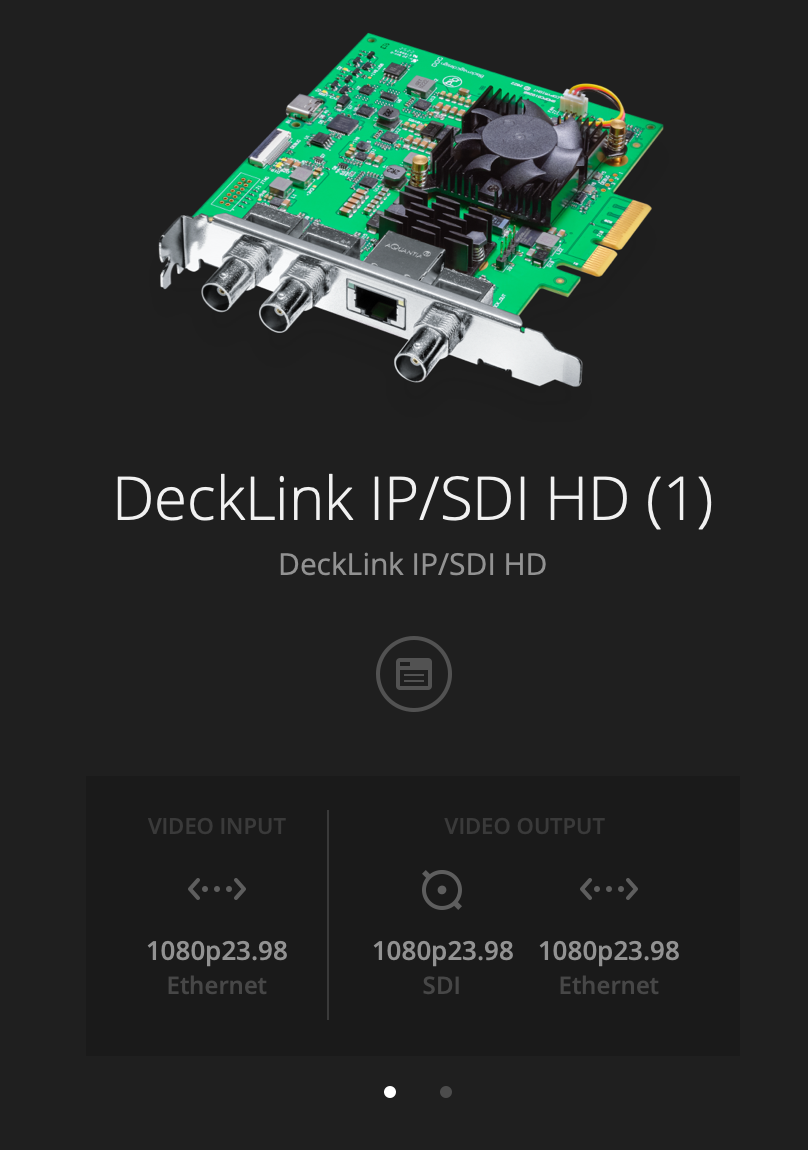
If the configuration is correct and both cards see each other, you should be able to see the signal info on the receiving end in the "Ethernet" section:

<figure><img src="https://565437294-files.gitbook.io/~/files/v0/b/gitbook-x-prod.appspot.com/o/spaces%2F-MFqn5MuayPgQPMZ9pwf%2Fuploads%2FGJDtQEGr46LzYa9vjYgX%2FCleanShot%202025-05-22%20at%2010.32.56%402x.png?alt=media&amp;token=ec15fcf8-58ba-499a-bc9b-1d2c06c7a337" alt=""><figcaption><p>Video Input is recognized properly</p></figcaption></figure>

Also make sure that the signal settings are set properly - looks like auto-detection doesn't work properly and sending RGB signal (4:4:4) can cause issues on the receiving end:

<figure><img src="https://565437294-files.gitbook.io/~/files/v0/b/gitbook-x-prod.appspot.com/o/spaces%2F-MFqn5MuayPgQPMZ9pwf%2Fuploads%2FyR8PaaENlmGE2t7U2hM3%2FCleanShot%202025-05-22%20at%2010.33.13%402x.png?alt=media&amp;token=3d467e12-595d-4053-ad27-eeadf87eca2a" alt=""><figcaption><p>Monitoring settings on the sender side</p></figcaption></figure>

{% hint style="info" %}
Both cards can be connected with a regular ethernet cable (doesn't need to be crossed). CAT.6 cable is recommended.
{% endhint %}


# HDR & SDR monitoring with DeckLink 8K Pro

Simultaneous HDR and trim SDR signals monitoring with DeckLink 8K Pro

This guide covers setting up simultaneous HDR and SDR signal monitoring using two DeckLink 8K Pro cards — one on the sending end and one on the receiving end.

First, configure the ports on both cards using the **Desktop Video** app as follows:

<figure><img src="https://565437294-files.gitbook.io/~/files/v0/b/gitbook-x-prod.appspot.com/o/spaces%2F-MFqn5MuayPgQPMZ9pwf%2Fuploads%2FtaOI1f6U8Eggc8pLyV9P%2FCleanShot%202023-06-16%20at%2014.41.26%402x.png?alt=media&amp;token=381b8494-ed7b-44d6-9038-2a680ee8c05b" alt=""><figcaption></figcaption></figure>

Edit the connector settings in every sub-device and set them to **In or Out**:

![](https://565437294-files.gitbook.io/~/files/v0/b/gitbook-x-prod.appspot.com/o/spaces%2F-MFqn5MuayPgQPMZ9pwf%2Fuploads%2FOjth608X6CUi5hTIRFbx%2FCleanShot%202023-06-16%20at%2014.41.53%402x.png?alt=media\&token=b0a511c2-50ca-4a5f-8d98-4cc9a7b2eb93) ![](https://565437294-files.gitbook.io/~/files/v0/b/gitbook-x-prod.appspot.com/o/spaces%2F-MFqn5MuayPgQPMZ9pwf%2Fuploads%2F0AYixxStY7SPJf6cn4UV%2FCleanShot%202023-06-16%20at%2014.41.59%402x.png?alt=media\&token=f9438115-45cc-4ee3-ad5e-95253c1b57dd) ![](https://565437294-files.gitbook.io/~/files/v0/b/gitbook-x-prod.appspot.com/o/spaces%2F-MFqn5MuayPgQPMZ9pwf%2Fuploads%2FUQPuwGNp7SsVC2mZENxe%2FCleanShot%202023-06-16%20at%2014.42.05%402x.png?alt=media\&token=502f8f01-b052-49c7-93c5-ec22aaaac6f9) ![](https://565437294-files.gitbook.io/~/files/v0/b/gitbook-x-prod.appspot.com/o/spaces%2F-MFqn5MuayPgQPMZ9pwf%2Fuploads%2FMKiP8ySgY54JsC751TL1%2FCleanShot%202023-06-16%20at%2014.42.12%402x.png?alt=media\&token=cf6dd3a4-e3b6-46a1-90ca-a18f17202dbb)

Here is the port numbering on the device:

<figure><img src="https://565437294-files.gitbook.io/~/files/v0/b/gitbook-x-prod.appspot.com/o/spaces%2F-MFqn5MuayPgQPMZ9pwf%2Fuploads%2Fjb2yJRP30WsKbV5R7rHQ%2FCleanShot%202023-06-16%20at%2014.47.00%402x.png?alt=media&amp;token=a6edbc04-d330-4d7a-b970-5b31df8ebab9" alt=""><figcaption></figcaption></figure>

This is how the two boards should be connected:

<figure><img src="https://565437294-files.gitbook.io/~/files/v0/b/gitbook-x-prod.appspot.com/o/spaces%2F-MFqn5MuayPgQPMZ9pwf%2Fuploads%2FCiobYIrAQQNj0GaIjgbO%2Fdecklink8kpro_connections.jpg?alt=media&amp;token=397ee757-bd66-4ed1-996b-3a21e4a51fe6" alt=""><figcaption></figcaption></figure>

Configure the DeckLink device in DaVinci Resolve as follows:

<figure><img src="https://565437294-files.gitbook.io/~/files/v0/b/gitbook-x-prod.appspot.com/o/spaces%2F-MFqn5MuayPgQPMZ9pwf%2Fuploads%2FAftVl2L6ElHLUaa7o1jt%2FCleanShot%202023-06-16%20at%2014.44.04%402x.png?alt=media&amp;token=d0d9477d-0201-4e17-a67d-22e888031c51" alt=""><figcaption></figcaption></figure>

When DeckLink 1 is selected as the monitoring device, physical port 1 outputs HDR and port 3 outputs SDR.

Connect to **DeckLink (1)** and **DeckLink (2)** in OmniScope for simultaneous HDR and SDR monitoring:

![](https://565437294-files.gitbook.io/~/files/v0/b/gitbook-x-prod.appspot.com/o/spaces%2F-MFqn5MuayPgQPMZ9pwf%2Fuploads%2FXQFaThISeqqFC8VvpmCO%2FCleanShot%202023-06-16%20at%2014.57.53%402x.png?alt=media\&token=afae24b0-3fef-4e57-9da9-49df464d6e3d)

Make sure to use the following **Input Settings** in OmniScope:

<figure><img src="https://565437294-files.gitbook.io/~/files/v0/b/gitbook-x-prod.appspot.com/o/spaces%2F-MFqn5MuayPgQPMZ9pwf%2Fuploads%2Fgit-blob-429ae77844c6a1789bca6d7fd3821fd8883ab6a9%2F2026-02_decklink_signal_range.jpg?alt=media" alt=""><figcaption><p>OmniScope input source settings</p></figcaption></figure>

Once both inputs are configured and you set up a dual-source layout, you should see something like this:

<figure><img src="https://565437294-files.gitbook.io/~/files/v0/b/gitbook-x-prod.appspot.com/o/spaces%2F-MFqn5MuayPgQPMZ9pwf%2Fuploads%2Fen7iXDtDtftDP3wInzRW%2FCleanShot%202023-06-16%20at%2014.42.54%402x.png?alt=media&amp;token=ade97379-4d25-4143-9783-7a430ec66816" alt=""><figcaption></figcaption></figure>


# Signal Range

How to control the signal range

OmniScope can monitor signal in both Video (legal) and Full (data) range. To get accurate readings, the signal range settings must match between your source application and OmniScope.

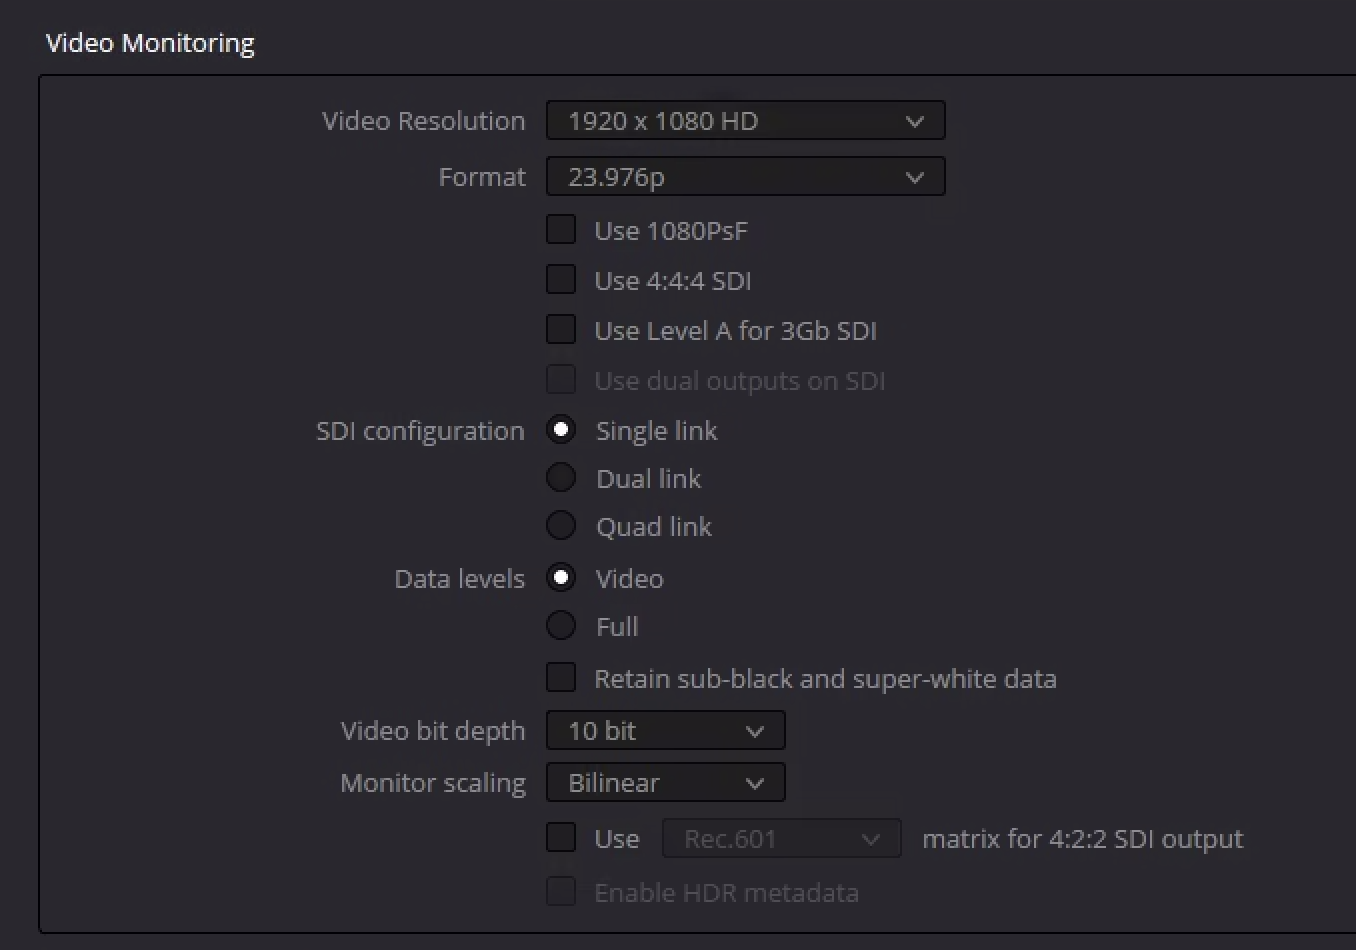
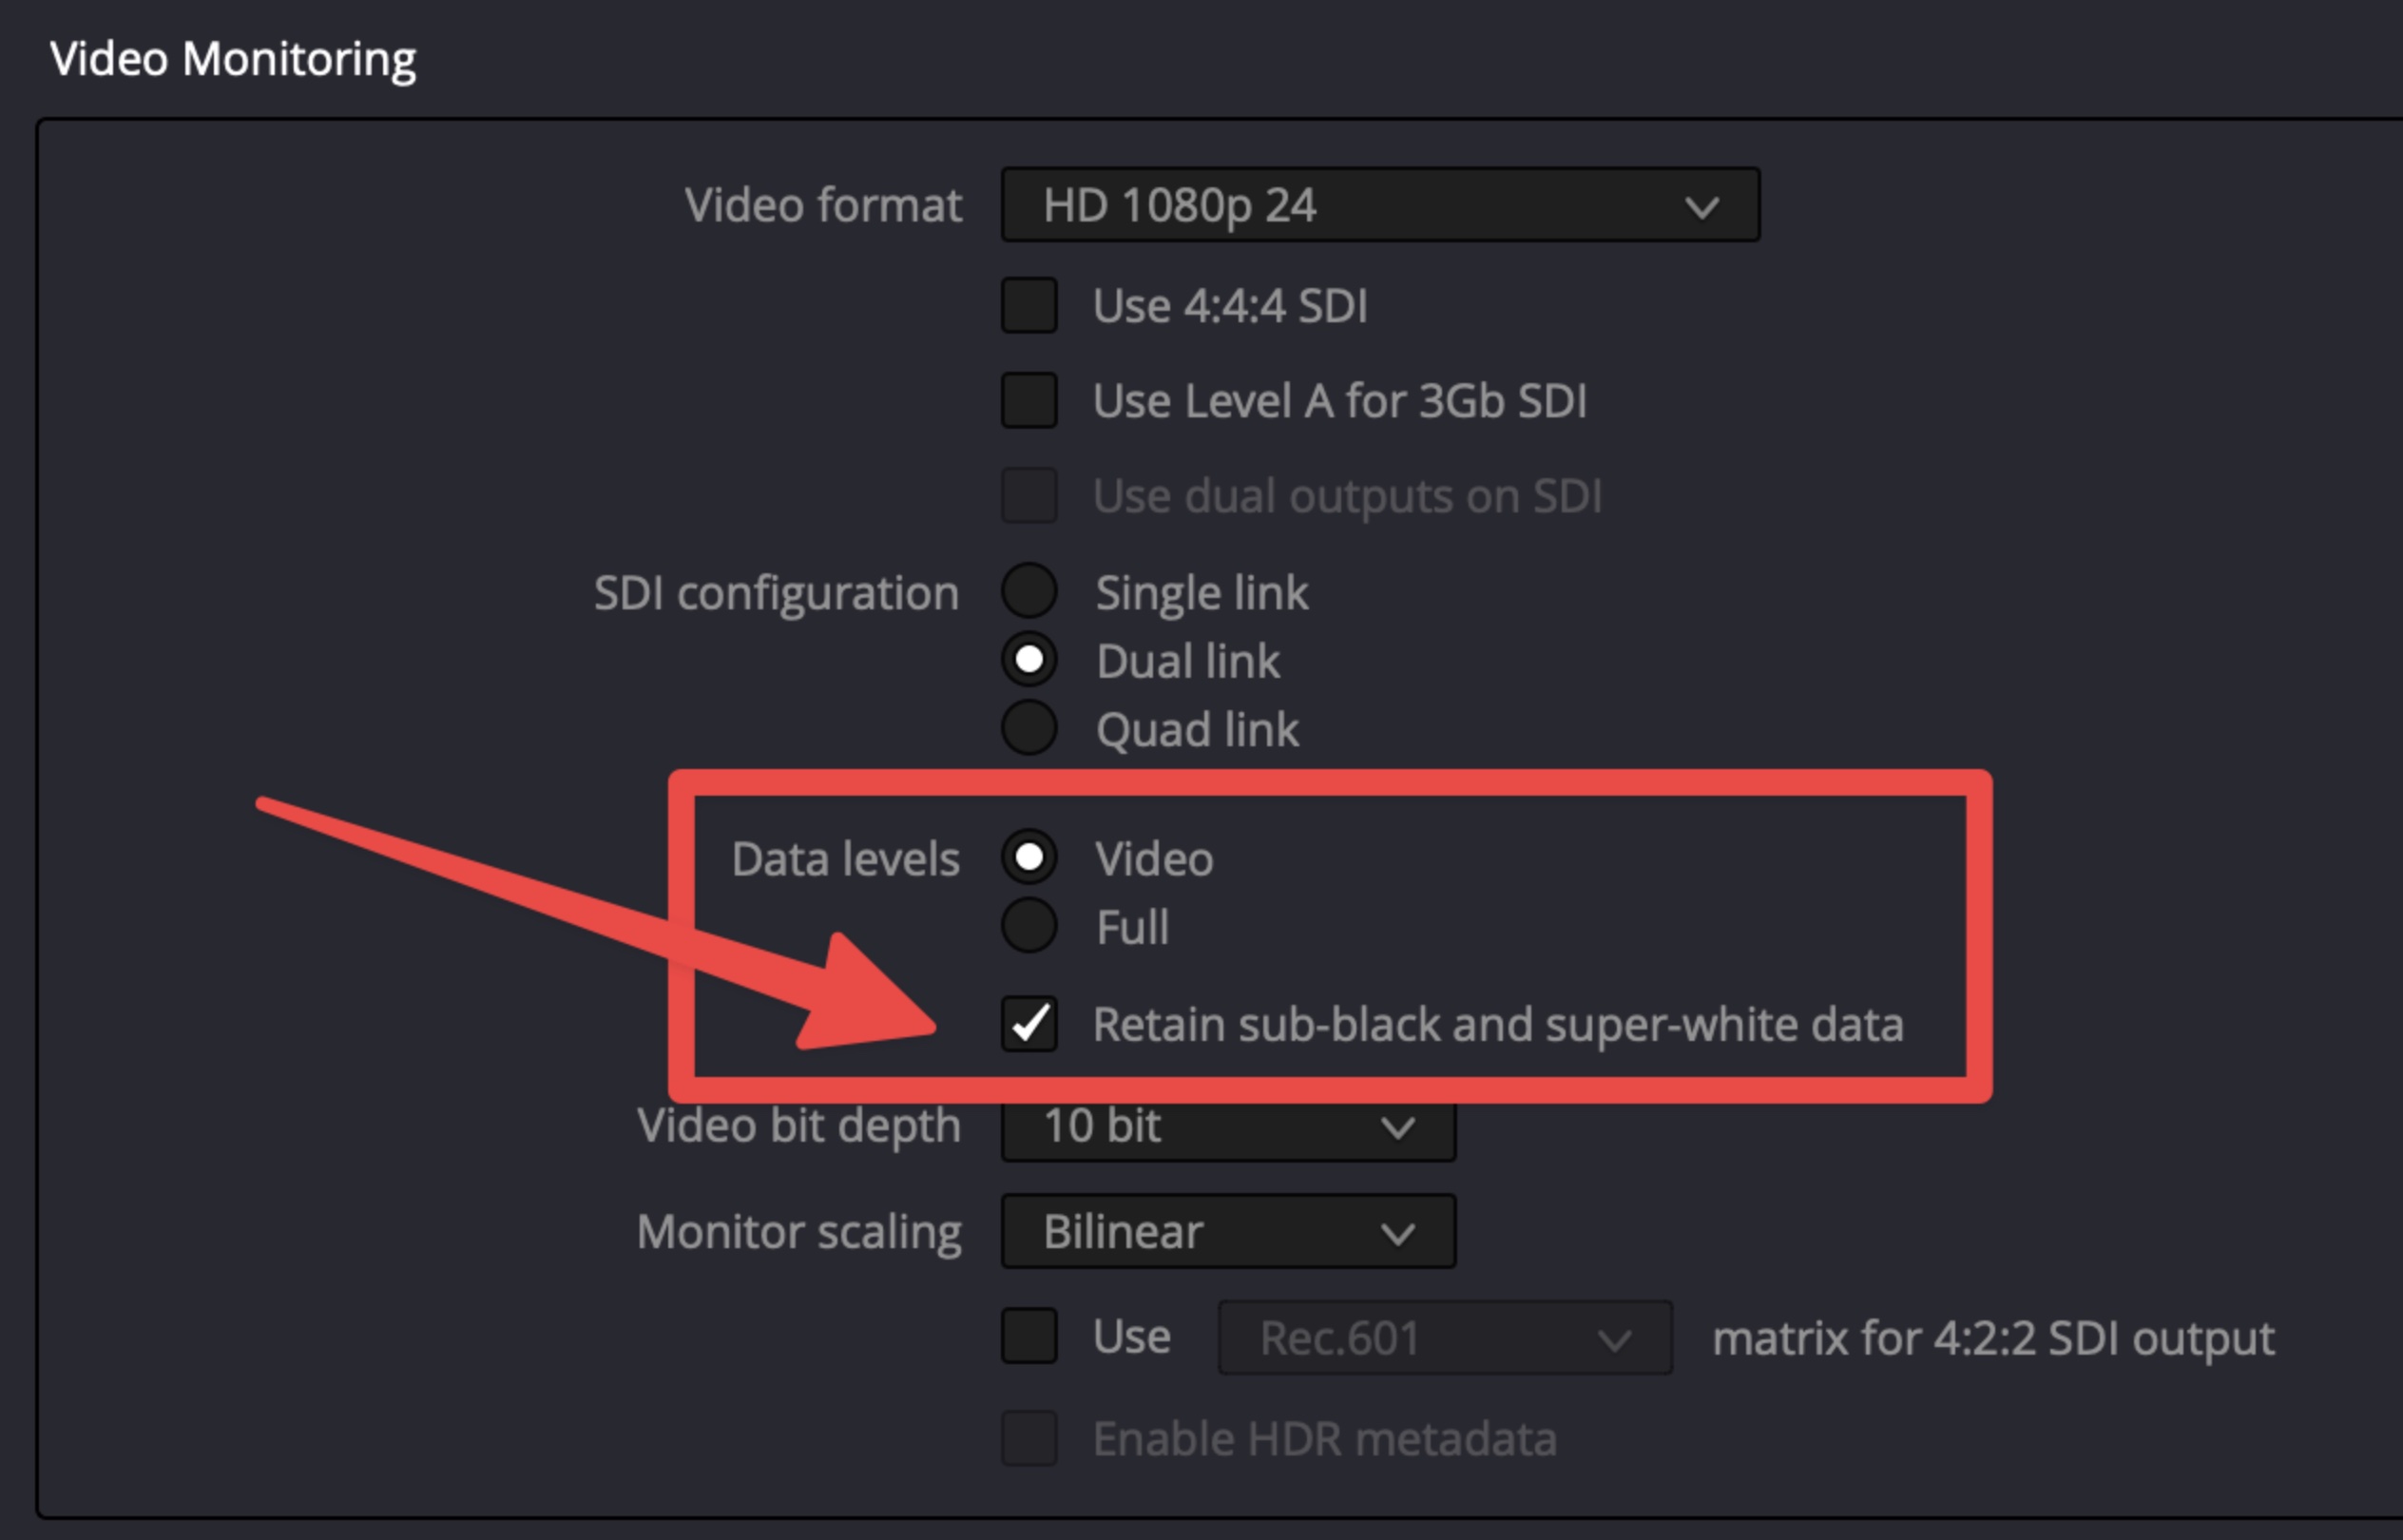
In DaVinci Resolve, go to Monitoring settings where **Data levels** can be set to **Video** or **Full**. When set to Video, you can also enable **Retain sub-black and super-white data** to monitor signal outside of the legal range.

<figure><img src="https://565437294-files.gitbook.io/~/files/v0/b/gitbook-x-prod.appspot.com/o/spaces%2F-MFqn5MuayPgQPMZ9pwf%2Fuploads%2FNAciTu4STyCzwcDwdPWf%2FCleanShot%202023-02-21%20at%2021.56.31%402x.png?alt=media&amp;token=5314650b-1118-45cf-b1b6-810f676765fe" alt=""><figcaption></figcaption></figure>

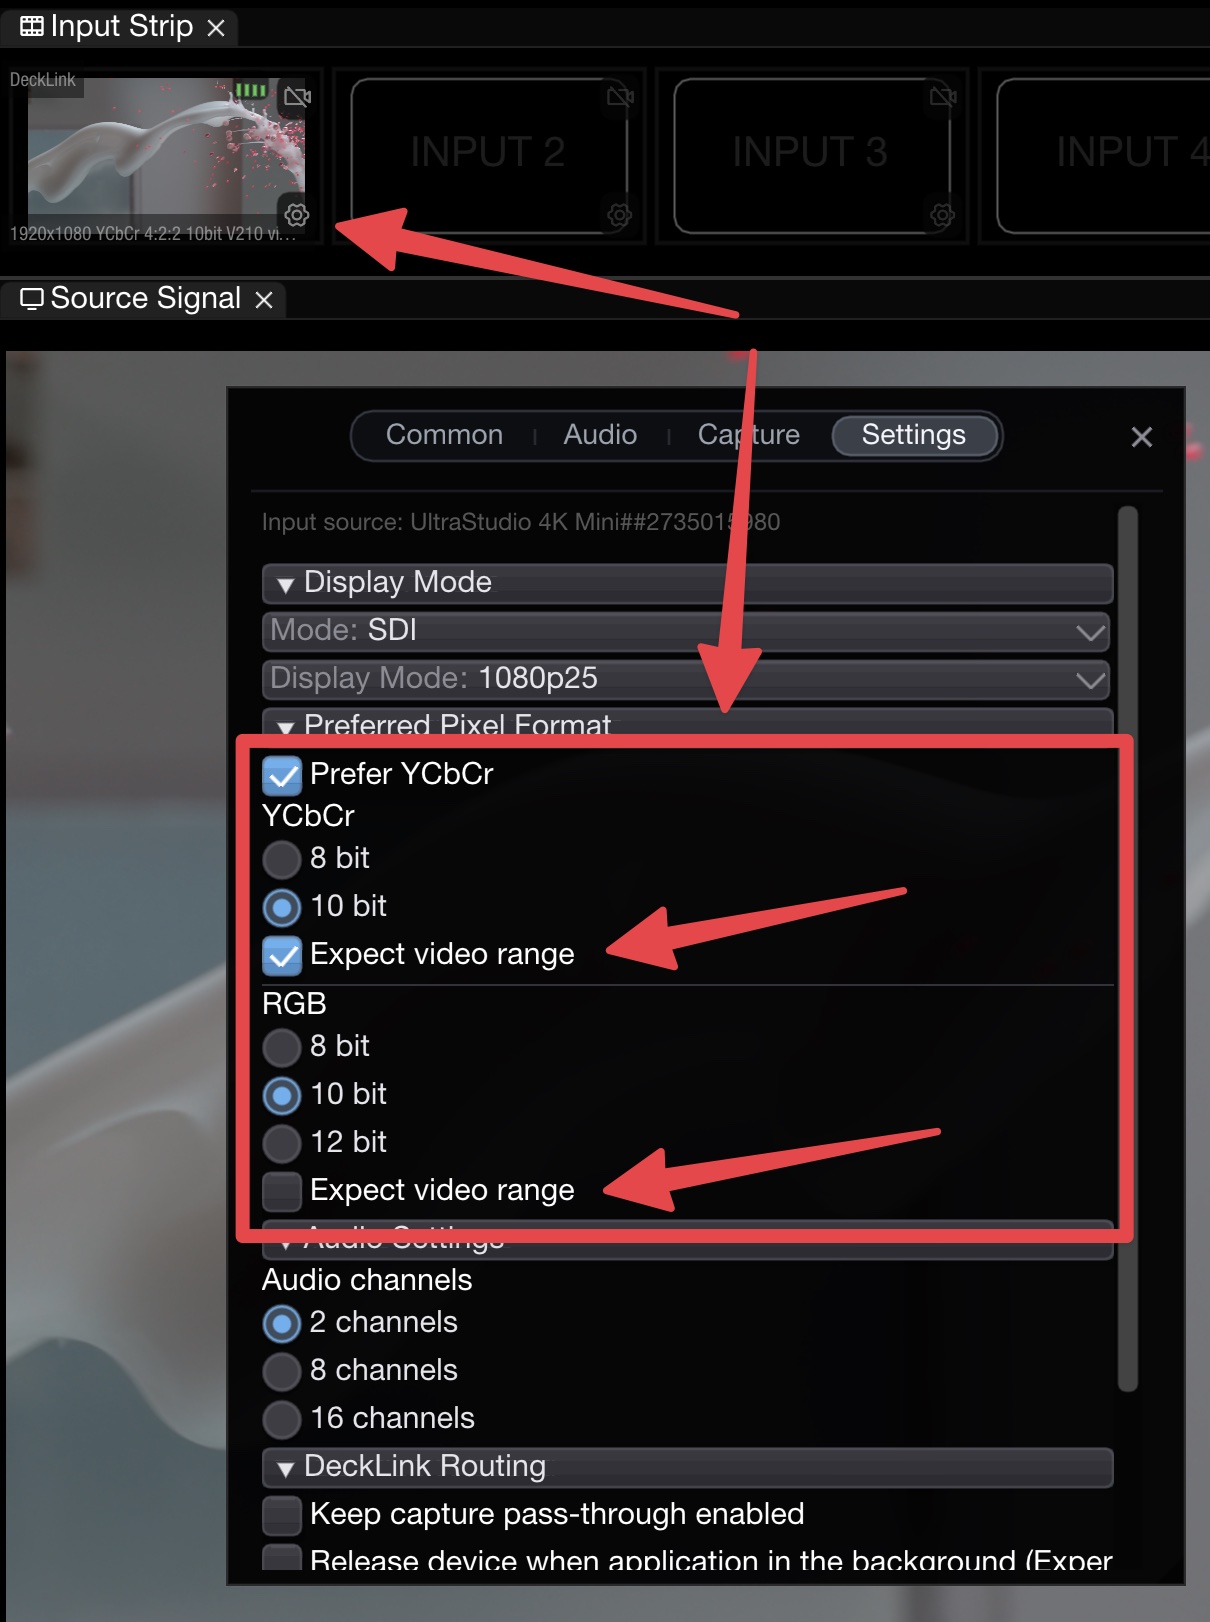
To make sure the signal is displayed correctly in OmniScope, open **Input Settings** (from the **Connect** menu or the gear icon in the toolbar, then the **Settings** tab):

<figure><img src="https://565437294-files.gitbook.io/~/files/v0/b/gitbook-x-prod.appspot.com/o/spaces%2F-MFqn5MuayPgQPMZ9pwf%2Fuploads%2Fgit-blob-fce85641ae7beb24ca8099d6e4c58b76bba18adf%2F2026-02_scale_signal_input_settings.jpg?alt=media" alt=""><figcaption><p>Scale signal setting in Input Settings</p></figcaption></figure>

<figure><img src="https://565437294-files.gitbook.io/~/files/v0/b/gitbook-x-prod.appspot.com/o/spaces%2F-MFqn5MuayPgQPMZ9pwf%2Fuploads%2Fgit-blob-429ae77844c6a1789bca6d7fd3821fd8883ab6a9%2F2026-02_decklink_signal_range.jpg?alt=media" alt=""><figcaption><p>Signal range in Preferences</p></figcaption></figure>

The key settings are **Expect video range** and **Scale the video/SDI range to the full range**. If **Data levels** in Resolve's Monitoring Settings is set to **Video**, then **Expect video range** should be enabled here.

OmniScope keeps the source's native range metadata separate from the internal full-range processing image. This means waveform, histogram, and numeric source readouts can follow the actual Video or Full range of the incoming signal instead of guessing from the display transform.

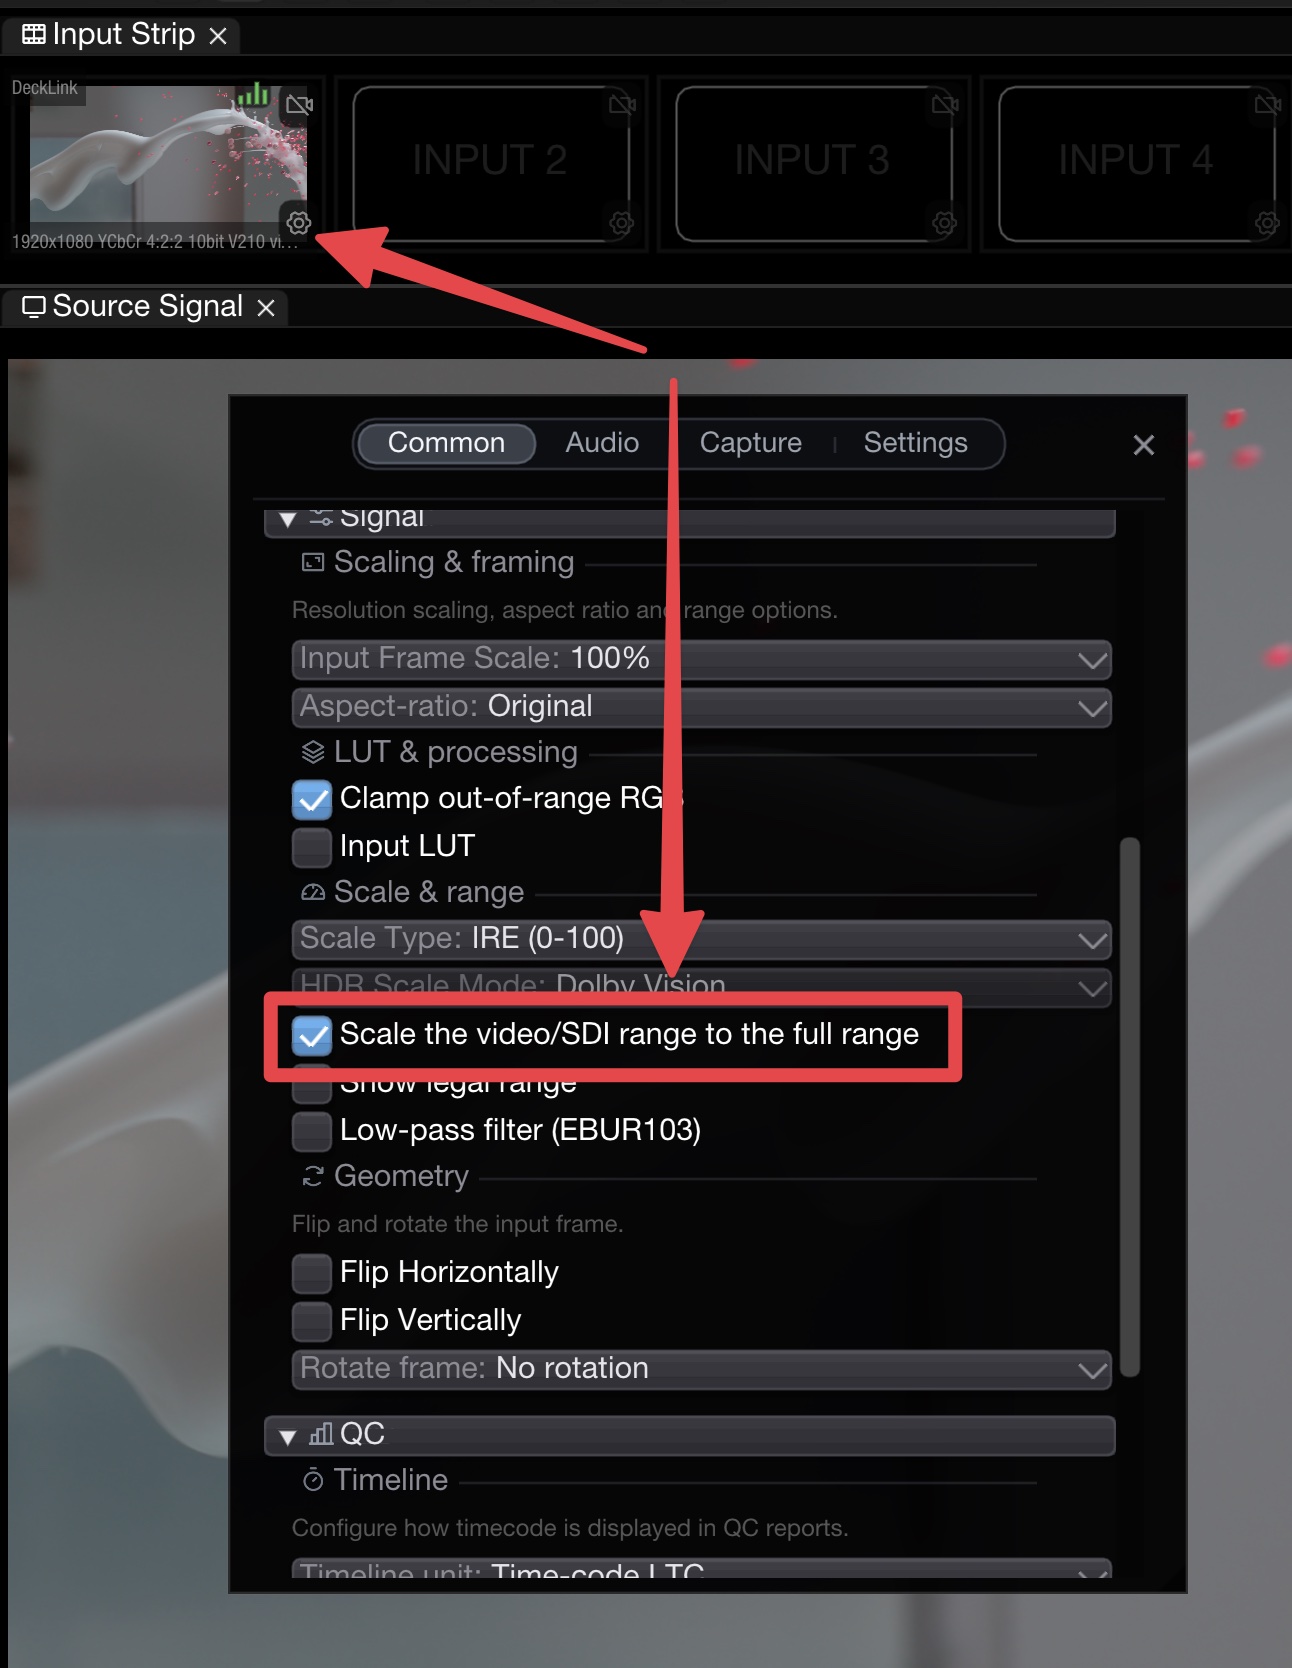
If you want the waveform and numeric readouts to stay in legal/video code values, also uncheck **Scale the video/SDI range to the full range** in OmniScope (**Options / Preferences / Signal**). When that scaling remains enabled, OmniScope presents the signal in full-range display space even if the source itself is tagged as video range.

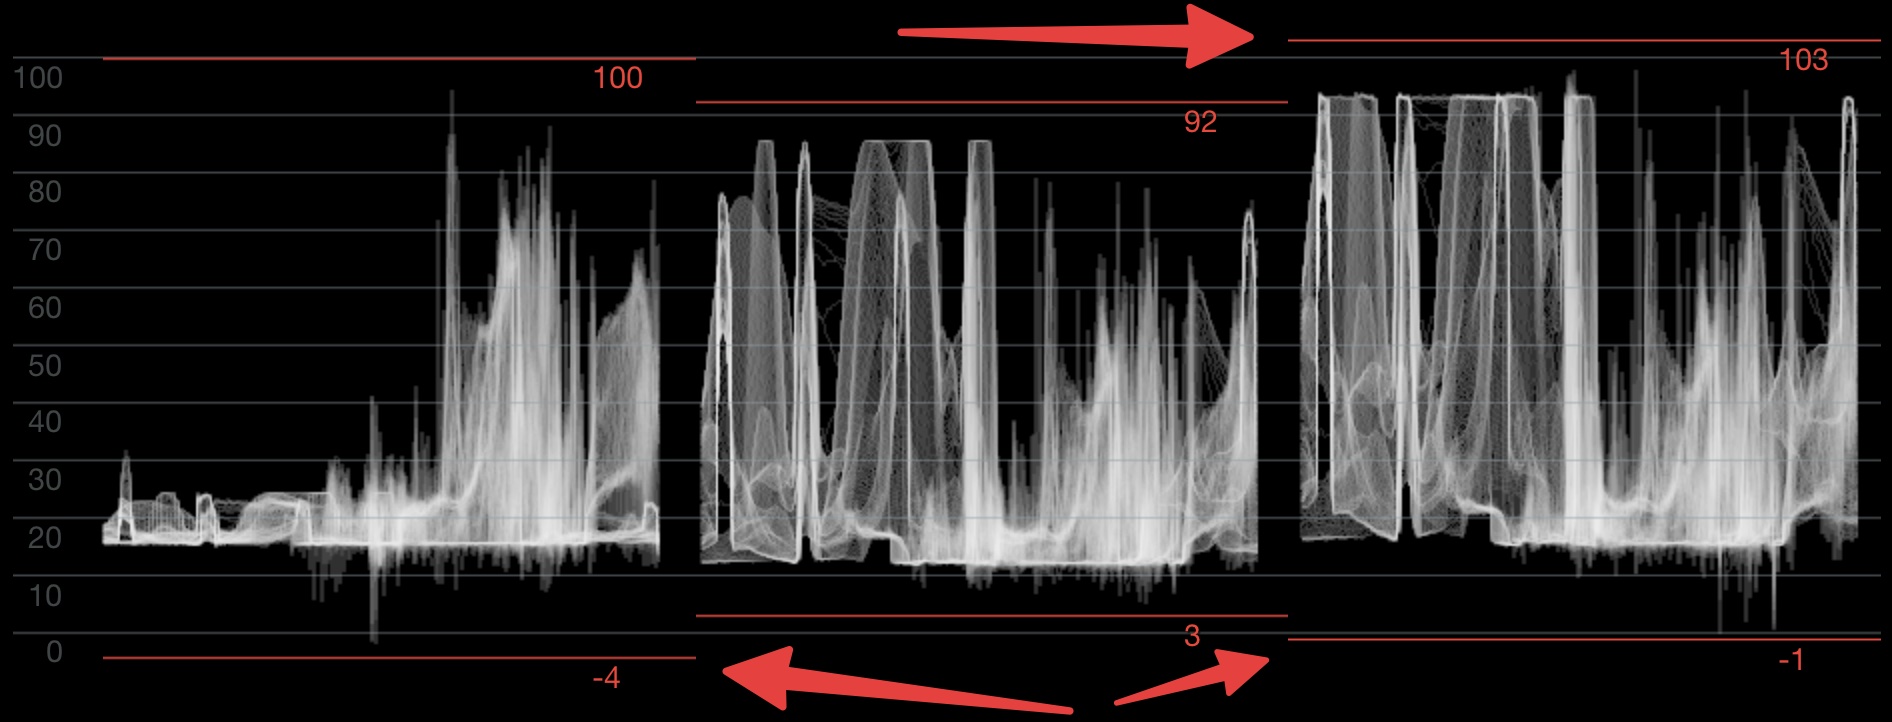
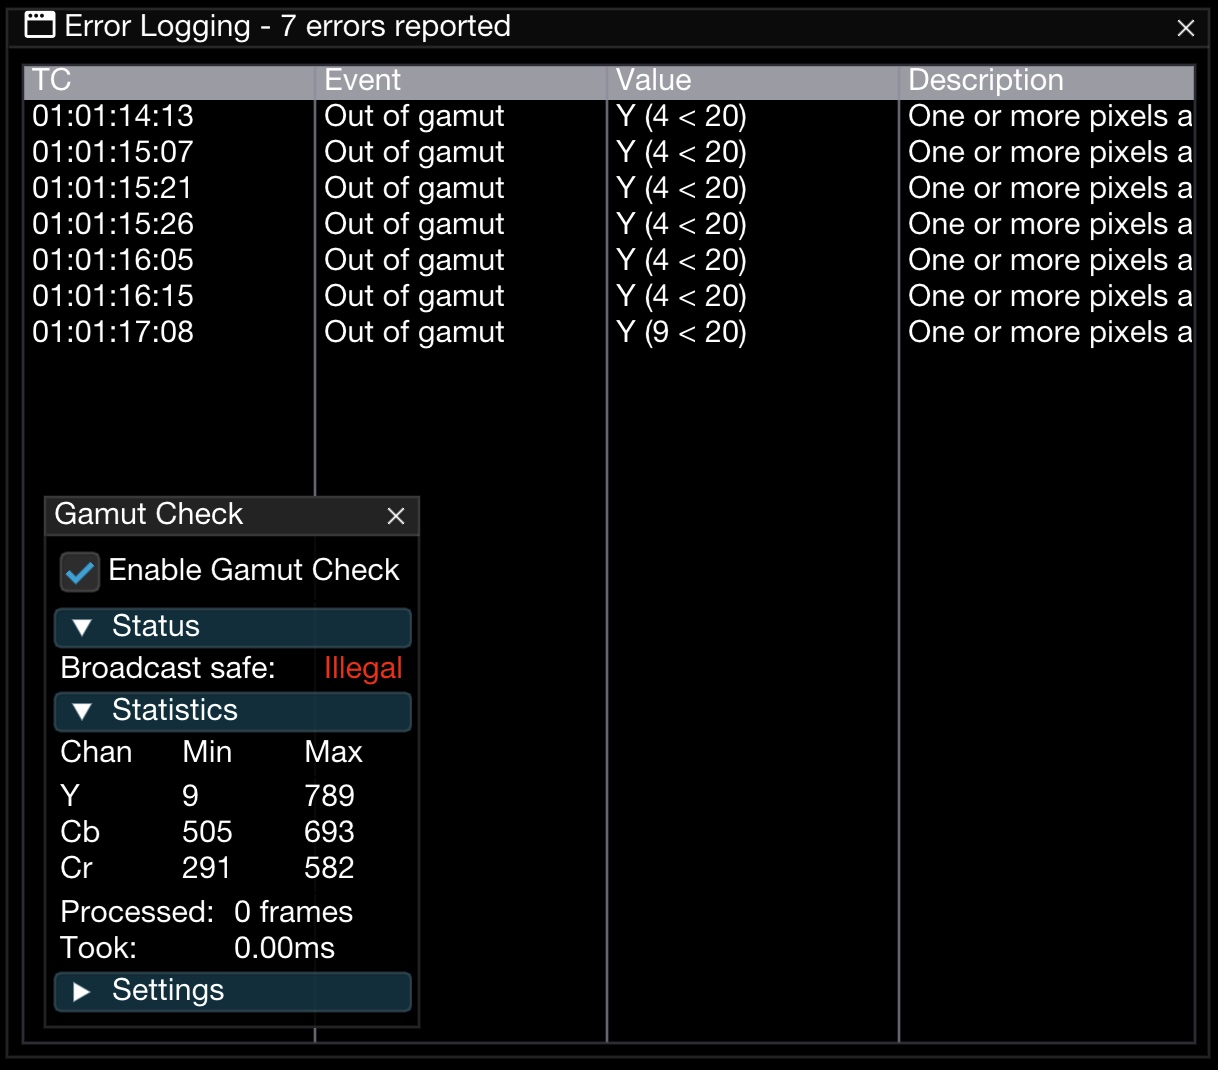
To monitor out-of-gamut values (outside legal range), make sure **Retain sub-black and super-white data** is enabled in Resolve's Monitoring settings and leave **Scale the video/SDI range to the full range** disabled. Otherwise out-of-gamut values will be clipped from the displayed trace.


# AJA

Nobe OmniScope supports any AJA SDI or HDMI input card (both PCIe and Thunderbolt). It will be detected automatically and displayed in the “Connect to…” dialog box.

### REC Badge

Supported AJA SDI sources can show a **REC** badge in the Source Viewer when embedded frame-status metadata reports that the camera is actively recording. This gives you a quick visual confirmation without opening additional diagnostics.


# UHD Quad Link config for AJA Kona 4

How to configure AJA card in QuadLink SDI for UHD monitoring

AJA cards need special handling when configured in QuadLink mode. Here's how to configure AJA Kona 4 to monitor UHD signal in QuadLink SDI configuration.

We are going to be using DeckLink 8K Pro on sending side and AJA Kona 4 on receiving side.

### Wiring

Here's DeckLink port numbering:

<figure><img src="https://565437294-files.gitbook.io/~/files/v0/b/gitbook-x-prod.appspot.com/o/spaces%2F-MFqn5MuayPgQPMZ9pwf%2Fuploads%2FTl7mGmqfqTG5th7kqsFa%2Fdecklink_ports.png?alt=media&amp;token=5d9d3a48-2b20-45c7-928b-4ceaaaacb646" alt=""><figcaption></figcaption></figure>

And AJA Kona 4 on the other end:

<figure><img src="https://565437294-files.gitbook.io/~/files/v0/b/gitbook-x-prod.appspot.com/o/spaces%2F-MFqn5MuayPgQPMZ9pwf%2Fuploads%2FTfbuoMr5Hlcpe48GQN0i%2Faja_ports.png?alt=media&amp;token=ba0fec30-8d3a-4691-aeb1-b9cb507153e4" alt=""><figcaption></figcaption></figure>

### Configuring the sender

DeckLink connectors should be configured in SDI 1 to 4 In or Out way:

<figure><img src="https://565437294-files.gitbook.io/~/files/v0/b/gitbook-x-prod.appspot.com/o/spaces%2F-MFqn5MuayPgQPMZ9pwf%2Fuploads%2F5EynfglxhQXEZ3nuQUdn%2FCleanShot%202023-10-28%20at%2016.19.37%402x.png?alt=media&amp;token=f3d83b3f-e9d7-44b0-9d90-3968a4c655c8" alt=""><figcaption></figcaption></figure>

And DaVinci Resolve monitoring settings as follows:

<figure><img src="https://565437294-files.gitbook.io/~/files/v0/b/gitbook-x-prod.appspot.com/o/spaces%2F-MFqn5MuayPgQPMZ9pwf%2Fuploads%2FsuRn6NjPZqZX0htd7dd3%2FCleanShot%202023-10-28%20at%2016.20.29%402x.png?alt=media&amp;token=12f82627-fc87-4250-bab6-efd9e02e266e" alt=""><figcaption></figcaption></figure>

### Configuring the receiver

On the receiving end, configure AJA card using AJA ControlPanel to expect 4 SDI inputs in QuadLink configuration and make sure to check the QuadLink UHD option in the input settings in OmniScope:

<figure><img src="https://565437294-files.gitbook.io/~/files/v0/b/gitbook-x-prod.appspot.com/o/spaces%2F-MFqn5MuayPgQPMZ9pwf%2Fuploads%2FcNMYCvBEngXjhlY1iY7Y%2Fconfig.png?alt=media&amp;token=314d3e46-1057-48a4-b76f-450ab3eb40f8" alt=""><figcaption></figcaption></figure>


# DeltaCast

DeltaCast SDI capture input for OmniScope

Available in version **1.11.50+**.

OmniScope can capture live SDI video from supported **DeltaCast** cards on **macOS** and **Windows**. DeltaCast devices appear in the **Connect to...** dialog as:

* `DeltaCast: <model> (RX0)`
* `DeltaCast: <model> (RX1)`

Each RX channel is exposed as a separate input source, so multi-channel cards can provide more than one selectable input.

## Connect a DeltaCast source

1. Install the DeltaCast **VideoMaster** driver/runtime so the card is visible to the system.
2. Open **Input > Connect to...**
3. Find the **DeltaCast** section and select the required RX channel.

If OmniScope cannot see the VideoMaster API or no boards are available, the DeltaCast source will not appear in the source list.

## Source settings

DeltaCast inputs expose a small source-specific settings panel:

| Setting             | Description                                                                                |
| ------------------- | ------------------------------------------------------------------------------------------ |
| **Pixel Format**    | Choose **YUV 10-bit (V210)** or **YUV 8-bit (UYVY)**.                                      |
| **Queue Depth**     | Adjust the internal frame queue depth.                                                     |
| **Restart Capture** | Restarts the DeltaCast capture stream after changing settings or troubleshooting a signal. |

When the source is running, OmniScope also shows the detected signal format and the active capture format in the settings panel.

## Genlock

DeltaCast inputs can select a genlock source from the source settings:

* **Reference Input**
* **RX0**
* **RX1**
* **Local Clock**

The current genlock status, reference format, source, and measured offset can be shown in [Text Display](/nobe-omniscope/scopes/text-display).

## Text Display placeholders

Available in version **1.11.50+**.

DeltaCast inputs populate Text Display placeholders for:

* **Genlock** status, lock state, source, reference format, and offset
* **SDI RX signal health** including lock state, carrier presence, sync errors, ANC errors, CRC/EDH error state, and CRC line error count


# NDI®

NDI® input sources are automatically displayed in the **Connect to** dialog. No additional configuration is needed — OmniScope discovers all active NDI® senders on the network.

For NDI® output options, see [NDI® Output](/nobe-omniscope/outputs/ndi-output).


# DaVinci Resolve OFX

The OFX plugin is installed automatically on Windows. On macOS, select **Options / Install plugins…**

<figure><img src="https://565437294-files.gitbook.io/~/files/v0/b/gitbook-x-prod.appspot.com/o/spaces%2F-MFqn5MuayPgQPMZ9pwf%2Fuploads%2Fgit-blob-85f934ce81d2aec657a6191bb20c3f3ea9c3b61d%2F2026-02_install_plugins_macos.jpg?alt=media" alt=""><figcaption><p>Install individual plugins</p></figcaption></figure>

{% hint style="info" %}
If Resolve is open please restart it to reload the OFX plugin.
{% endhint %}

## Using OpenFX plugin in DaVinci Resolve

### Adjustment Layer <a href="#adjustment-layer" id="adjustment-layer"></a>

To easily monitor all the clips in the timeline create an adjustment layer above your clips in the timeline in the **Edit Page**, and place the OpenFX plugin on top of that layer.

Find **Effects** in the **Toolbox** in your **Edit Page** on the left side of your timeline:

![Drag Adjustment Clip to your timeline](https://565437294-files.gitbook.io/~/files/v0/b/gitbook-legacy-files/o/assets%2F-MFqn5MuayPgQPMZ9pwf%2F-MHjg3E2AxUDgyZGrumW%2F-MHjitLy6h505v3OODHT%2FScreenshot%202020-09-21%20at%2010.13.42.jpg?alt=media\&token=63f7202f-acbe-4571-99d5-abc20b4fc734)

And then drag the **OmniScope Connect** plugin on top of that **Adjustment Clip**:

![Apply OmniScope Connect OpenFX plugin onto that Adjustment Clip](https://565437294-files.gitbook.io/~/files/v0/b/gitbook-legacy-files/o/assets%2F-MFqn5MuayPgQPMZ9pwf%2F-MHjg3E2AxUDgyZGrumW%2F-MHjizYfnLmirWu_2oQr%2FScreenshot%202020-09-21%20at%2010.14.03.jpg?alt=media\&token=55e1fd84-681d-454d-b7e8-81bb1c8d841b)

## Timeline node

Alternatively, you can use **Timeline Node** in the **Color Page**:

![Apply OmniScope Connect OpenFX plugin onto that](https://565437294-files.gitbook.io/~/files/v0/b/gitbook-legacy-files/o/assets%2F-MFqn5MuayPgQPMZ9pwf%2F-MG3MBrdysbWxo00uH6A%2F-MG3Mog_CztsMYm-icEc%2Fimage.png?alt=media\&token=54cb1ce9-37c9-4cb2-8468-587a50f2d3af)

{% hint style="info" %}
Placing an OpenFX plugin in the Timeline node can cause side effects when Caching is enabled in Resolve - the plugin can start sending frames to OmniScope once background renderer is started even if the clip is paused.\
\
To fix that please use the **Adjustment Layer** approach above.
{% endhint %}


# Signal Range

Full range vs Video range

## Overview

When integrating OmniScope with OpenFX, users can choose between two signal modes: **Full Range** and **Video Range**. The choice affects how pixel values leaving Resolve are mapped into OmniScope's internal code-value space — and, as a consequence, what the legal-range graticules actually mean.

<figure><img src="https://565437294-files.gitbook.io/~/files/v0/b/gitbook-x-prod.appspot.com/o/spaces%2F-MFqn5MuayPgQPMZ9pwf%2Fuploads%2FMR0ho7gOHO2CpTV9vZEm%2FCleanShot%202024-04-21%20at%2009.53.19%402x.png?alt=media&amp;token=5daa2a13-3448-4260-bc54-7f0f873a8790" alt=""><figcaption><p>Signal range selection in OpenFX plugin settings</p></figcaption></figure>

## What "video range" and "full range" mean

Both modes use the same 10-bit container (0–1023 code values), but they **scale** the signal differently.

| Mode                                            | Black   | Nominal white | Headroom                  | Footroom                    |
| ----------------------------------------------- | ------- | ------------- | ------------------------- | --------------------------- |
| **Video Range** (a.k.a. narrow / legal / SMPTE) | code 64 | code 940      | 941–1019 ("super-whites") | 1–63 ("blacker than black") |
| **Full Range**                                  | code 0  | code 1023     | none                      | none                        |

Video Range is the traditional broadcast convention inherited from analog composite video — the signal is delivered with deliberate headroom above and below the nominal 0–100 IRE window for analog over-/undershoots. Legal-range QC (EBU R103, SMPTE RP 2077) is defined on these ranges.

Full Range uses the entire code-value space. It's the native convention for computer-generated content, stills, and modern digital cameras recording in scene-linear or log formats. There is no footroom/headroom — code 0 is absolute black, code 1023 is absolute white.

## When to use which

### Video Range

Choose Video Range when your goal is to verify narrow-range legal delivery — i.e. you want to *see* the 64 / 940 guides on the waveform, catch super-whites that exceed 940, or fail pixels that punch below 64.

* **Use case**: broadcast or streaming QC where the deliverable is Rec. 709 / Rec. 2020 narrow range and you need to match a spec like R103 or ARIB TR-B32.
* Headroom and footroom are preserved and visible; you can observe the full 1–1023 excursion of the source.

### Full Range

Choose Full Range in digital production pipelines where narrow-range legal checking is not the point — for example, grading ACES or DaVinci Wide Gamut timelines, working with stills or RAW, or checking CG renders.

* **Use case**: scene-linear or wide-gamut grading where the signal has already been expanded to fill the full 0–1023 container.
* The signal is clipped to 0–1023 in a 10-bit environment; anything outside that range in the source is lost *at the transport boundary*, so narrow-range over/undershoots are no longer recoverable once the signal crosses into OmniScope.
* Legal-range graticules are meaningless in this mode because there is no deliberate headroom/footroom to check against.

> **Important:** Video Range mode preserves the ability to *detect* super-whites; Full Range mode trades that ability for headroom-free signal fidelity. The choice should match the color-science stage you are measuring, not your personal preference.

## Summary

Choose **Video Range** for rigorous adherence to broadcast narrow-range specs; choose **Full Range** for digital-native pipelines where every code value matters and there is no "legal range" to check against.

For additional support or to address any concerns, please contact OmniScope support.


# Color-managed Timeline

How to work with ACES or DaVinci Wide Gamut timeline

## What "color-managed" means

A **color-managed timeline** keeps the image in a single wide-gamut, scene-referred working space (ACES AP1 / AP0, DaVinci Wide Gamut / DaVinci Intermediate, ARRI Wide Gamut, etc.) and only converts to the display's color space when the signal is about to be rendered for viewing. The advantages: every source camera feeds through its own IDT into the same space, creative operations (lift/gamma/gain, curves, qualifiers) all run in a mathematically consistent linear environment, and the final delivery transforms are swapped in or out without re-grading.

The catch: **the picture is not display-ready in the working space**. If you feed it to a monitor or a scope that assumes it's already in a display color space, the image looks flat and muddy because the tone-mapping / gamma / RRT steps haven't been applied. This is why OmniScope needs to know the timeline color space — otherwise its scopes would plot scene-linear numbers against display-referred graticules.

## ACES Monitoring

OmniScope has built-in ACES support via OpenColorIO. When using an ACES color-science timeline in DaVinci Resolve, OmniScope can decode the ACES color space directly — no CST sandwich nodes or 3D LUTs required. Internally OmniScope applies the matching ODT (Output Device Transform) from its bundled ACES config, so what you see in the Source Signal view and on every scope matches what Resolve would show through its own ACES ODT.

### Step 1: DaVinci Resolve project setup

In **Project Settings / Color Management**, set Color science to **ACEScct** or **ACEScc** and select the desired ACES version.

<figure><img src="https://565437294-files.gitbook.io/~/files/v0/b/gitbook-x-prod.appspot.com/o/spaces%2F-MFqn5MuayPgQPMZ9pwf%2Fuploads%2Fgit-blob-e5d93a6f41f8f633e1f9a58fc37a5ec08df08dae%2F2026-03_aces_resolve_acescct.jpg?alt=media" alt=""><figcaption><p>DaVinci Resolve ACES project settings (ACEScct)</p></figcaption></figure>

<figure><img src="https://565437294-files.gitbook.io/~/files/v0/b/gitbook-x-prod.appspot.com/o/spaces%2F-MFqn5MuayPgQPMZ9pwf%2Fuploads%2Fgit-blob-2e97f3889f14fa59de7ced82fcff9ed87f9d421a%2F2026-03_aces_resolve_acescc.jpg?alt=media" alt=""><figcaption><p>DaVinci Resolve ACES project settings (ACEScc)</p></figcaption></figure>

### Step 2: OFX plugin settings

In the OmniScope Connect OFX plugin settings, set **Image Format** to **RGBA 32bit** and **Timeline** to match your Resolve color science (**ACEScct** or **ACEScc**).

<figure><img src="https://565437294-files.gitbook.io/~/files/v0/b/gitbook-x-prod.appspot.com/o/spaces%2F-MFqn5MuayPgQPMZ9pwf%2Fuploads%2Fgit-blob-2ef2ec6c18984bdaae070f0dfdefb4cc3cb0b311%2F2026-03_aces_ofx_settings.jpg?alt=media" alt=""><figcaption><p>OFX plugin settings — RGBA 32bit and ACEScct timeline</p></figcaption></figure>

{% hint style="warning" %}
You must select **RGBA 32bit** Image Format when working with ACES or DaVinci Wide Gamut. The default 8-bit mode does not have enough precision for these colorspaces.
{% endhint %}

### Step 3: OmniScope ACES version

In OmniScope **Preferences / OpenColorIO**, select the bundled ACES config version that matches your Resolve project — **ACES 1.3** or **ACES 2.0 (compat)**.

<figure><img src="https://565437294-files.gitbook.io/~/files/v0/b/gitbook-x-prod.appspot.com/o/spaces%2F-MFqn5MuayPgQPMZ9pwf%2Fuploads%2Fgit-blob-1dddcb0ad74b28c15338c69007a1de116e542eae%2F2026-03_aces_omniscope_preferences.jpg?alt=media" alt=""><figcaption><p>OmniScope Preferences — Bundled ACES config version</p></figcaption></figure>

You can also point OmniScope to a custom OCIO configuration if your facility requires bespoke transforms.

### Step 4: Verify input colorspace

OmniScope automatically detects the ACES colorspace from the OFX plugin and configures the input color management accordingly. You can verify and adjust the active colorspace in the **Input Settings** panel — the input colorspace should show **ACEScct** or **ACEScc** matching your timeline.

OmniScope uses its bundled OCIO config to convert from the ACES working space to the display colorspace for correct monitoring on your scopes and source signal view.

## DaVinci Wide Gamut

### Color Space Transform nodes (CST)

When you use Nobe OmniScope with DaVinci Resolve in Color Managed timeline and DaVinci Wide Gamut the preview will appear washed out. It's because Nobe OmniScope shows you the raw image data as is in the timeline. There's no display transform applied to the image at this stage yet.

<figure><img src="https://565437294-files.gitbook.io/~/files/v0/b/gitbook-x-prod.appspot.com/o/spaces%2F-MFqn5MuayPgQPMZ9pwf%2Fuploads%2FW9vHW1A4Km0sWeDj8ivW%2FCleanShot%202024-04-21%20at%2009.26.15%402x.png?alt=media&amp;token=c6a31c5a-2cc7-49e7-9ed2-c10a377c81ae" alt=""><figcaption><p>DaVinci Wide Gamut in Color Managed timeline</p></figcaption></figure>

In order to see the correct image in Nobe OmniScope we need to use 2 built-in OFX plugins called Color Space Transform, one before Nobe OmniScope Connect plugin, and one after:

<figure><img src="https://565437294-files.gitbook.io/~/files/v0/b/gitbook-x-prod.appspot.com/o/spaces%2F-MFqn5MuayPgQPMZ9pwf%2Fuploads%2Fbb4C0vz8YnGTbdyeTTJF%2FCleanShot%202024-04-21%20at%2009.32.23%402x.png?alt=media&amp;token=ee2646a4-a433-4383-8ba0-e8ee38dbe295" alt=""><figcaption><p>Color Space Transform "Sandwitch"</p></figcaption></figure>

Here are the settings that we should use in the node before Nobe OmniScope Connect:

<figure><img src="https://565437294-files.gitbook.io/~/files/v0/b/gitbook-x-prod.appspot.com/o/spaces%2F-MFqn5MuayPgQPMZ9pwf%2Fuploads%2F4d6d7suuzsCcNp2NkkME%2Fimage.png?alt=media&amp;token=cce3470a-aae5-4404-944b-1c36b1fdf59f" alt=""><figcaption><p>DWG to Rec.709</p></figcaption></figure>

And these are the settings to get back to DWG:

<figure><img src="https://565437294-files.gitbook.io/~/files/v0/b/gitbook-x-prod.appspot.com/o/spaces%2F-MFqn5MuayPgQPMZ9pwf%2Fuploads%2FqD9jJnfOj0PLggr3hN95%2Fimage.png?alt=media&amp;token=4bfa1771-2e5d-4dea-bcdf-2a578bfe0b96" alt=""><figcaption><p>Rec.709 to DWG</p></figcaption></figure>

### DWG to Rec.709 3D LUT

If you prefer not to use the CST node in Resolve to go back and forth between DWG and Rec.709 there's another way. You can use a 3D LUT to go from DaVinci Wide Gamut to Rec.709 directly in OmniScope.

Here's the 3D LUT file for download:\
:link:**DaVinci Wide Gamut**: <https://timeinpixels.com/files/dwg_to_rec709.cube.zip>\
:link:**ACEScc**: <https://timeinpixels.com/files/acescc_to_rec709.cube.zip>

Go to Options / 3D Luts in OmniScope and load up the file, then in the Input Settings select it from the list:

<figure><img src="https://565437294-files.gitbook.io/~/files/v0/b/gitbook-x-prod.appspot.com/o/spaces%2F-MFqn5MuayPgQPMZ9pwf%2Fuploads%2F9leZjy3eWlxoQK4Rxogz%2Fimage.png?alt=media&amp;token=257e9162-4f8e-4afc-a7f5-da724b9c90c9" alt=""><figcaption><p>Working with DWG using 3D LUT</p></figcaption></figure>


# Direct GPU Image Sharing

Direct GPU Image Sharing for macOS

Real-time OpenFX signal processing just became ultra-efficient on macOS:

* **Zero-latency GPU image sharing**: The OpenFX plugin now supports **direct GPU memory transfer**, removing costly CPU-GPU copies and enabling **instant signal handoff** to OmniScope.
* **Significantly reduced resource usage**: The plugin has been optimized to use **far less CPU and GPU**, especially when monitoring live Resolve timelines.
* For maximum efficiency, you can also **scale down the input resolution** in the plugin settings, ideal for heavy projects or low-power systems.

### How to enable Direct GPU Sharing

In OpenFX settings, enable "Direct GPU Sharing" option:<br>

<figure><img src="https://565437294-files.gitbook.io/~/files/v0/b/gitbook-x-prod.appspot.com/o/spaces%2F-MFqn5MuayPgQPMZ9pwf%2Fuploads%2F8VedeTDlv6JkGbFdKsff%2FCleanShot%202025-10-01%20at%2010.55.25%402x.png?alt=media&amp;token=292fdf53-0761-4d5b-83db-946c6040ffc6" alt=""><figcaption></figcaption></figure>

Then, after couple of seconds, Nobe OmniScope should auto-detect new **GPU Share Source** named "**NobeOmniScope Metal Output**":

<figure><img src="https://565437294-files.gitbook.io/~/files/v0/b/gitbook-x-prod.appspot.com/o/spaces%2F-MFqn5MuayPgQPMZ9pwf%2Fuploads%2FQWVw5qQoPpvTvcg6pXLZ%2FCleanShot%202025-10-01%20at%2010.55.39%402x.png?alt=media&amp;token=f7773c6e-c676-4cb3-96ee-53fb8ee45c0e" alt=""><figcaption></figcaption></figure>

After selecting this source the signal should now be shared directly through GPU with near zero latency.


# Premiere Pro & After Effects

Connecting OmniScope with Premiere Pro and After Effects

### Built-in plugin (Transmitter)

The Adobe Premiere Pro & After Effects plugin is installed automatically on Windows. On macOS, select **Options / Install plugins…**

<figure><img src="https://565437294-files.gitbook.io/~/files/v0/b/gitbook-x-prod.appspot.com/o/spaces%2F-MFqn5MuayPgQPMZ9pwf%2Fuploads%2Fgit-blob-85f934ce81d2aec657a6191bb20c3f3ea9c3b61d%2F2026-02_install_plugins_macos.jpg?alt=media" alt=""><figcaption><p>Install individual plugins</p></figcaption></figure>

If Premiere Pro / AE is open please restart it to reload the transmitter plugin.

From version **1.11.52**, OmniScope on macOS checks the installed transmitter at startup and warns when it does not match the current OmniScope version — an **Adobe Transmitter update required** notice opens the plugins window, where you can update the plugin with one click. If you prefer to keep the older plugin, tick **Don't ask again** to silence the warning until the next OmniScope update.

Then please go to Preferences / Playback…

![](https://565437294-files.gitbook.io/~/files/v0/b/gitbook-legacy-files/o/assets%2F-MFqn5MuayPgQPMZ9pwf%2F-MG3MrRIiDPptNty3j69%2F-MG3N85mW9TsQjEYDHEN%2Fimage.png?alt=media\&token=f3a7e6d2-72b1-47da-92f5-aa08357fc327)

And make sure Nobe OmniScope Transmitter is enabled:

![](https://565437294-files.gitbook.io/~/files/v0/b/gitbook-legacy-files/o/assets%2F-MFqn5MuayPgQPMZ9pwf%2F-MG3MrRIiDPptNty3j69%2F-MG3NBIWsjE34aMEzLH2%2Fimage.png?alt=media\&token=d09e6a5d-e0cb-42a5-bb79-d6d1d3673d90)

Once the configuration is complete you can now connect from OmniScope selecting Premiere Pro / AE in the Connect to dialog box.

### NDI

Alternatively, you can connect to Premiere Pro / After Effects through NDI plugin.

To install the NDI plugin please download:

* [NDI Tools for Windows](https://go.ndi.video/tools-for-windows)
* [NDI Tools for macOS](https://go.ndi.video/tools-for-mac)

When installing, make sure to select Premiere Pro / After Effects plugin.

Now, in the playback tools, please activate NDI output in the Playback Preferences:

<figure><img src="https://565437294-files.gitbook.io/~/files/v0/b/gitbook-x-prod.appspot.com/o/spaces%2F-MFqn5MuayPgQPMZ9pwf%2Fuploads%2Fuaj5xCnIhUfm0t3PWioN%2FCleanShot%202023-11-20%20at%2021.22.09%402x.png?alt=media&amp;token=352ffdb8-53fc-48f9-9234-c087436e1b8a" alt=""><figcaption></figcaption></figure>

Once this setting is enabled, Nobe OmniScope should be able to see its NDI signal as a new source.


# Assimilate Scratch

{% hint style="info" %}
OmniScope automatically discovers the Assimilate Scratch plugin when Scratch is running. The **Assimilate Scratch** source will appear in the Connect dialog without manual configuration.
{% endhint %}

The SDI plugin for Assimilate Scratch is installed automatically on Windows. On macOS, select **Options / Install plugins…**

<figure><img src="https://565437294-files.gitbook.io/~/files/v0/b/gitbook-x-prod.appspot.com/o/spaces%2F-MFqn5MuayPgQPMZ9pwf%2Fuploads%2Fgit-blob-85f934ce81d2aec657a6191bb20c3f3ea9c3b61d%2F2026-02_install_plugins_macos.jpg?alt=media" alt=""><figcaption><p>Install individual plugins</p></figcaption></figure>

Now the SDI plugin needs to be configured in Scratch. On the main page select System Settings…

![](https://565437294-files.gitbook.io/~/files/v0/b/gitbook-legacy-files/o/assets%2F-MFqn5MuayPgQPMZ9pwf%2F-MG3NEHwb8vEW-hOk48_%2F-MG3NKtXvnbRDSfNv-z2%2Fimage.png?alt=media\&token=64ad4938-ee78-4eaa-a800-51841015aef7)

Then “Configure..” in the SDI Settings section:

![](https://565437294-files.gitbook.io/~/files/v0/b/gitbook-legacy-files/o/assets%2F-MFqn5MuayPgQPMZ9pwf%2F-MG3NEHwb8vEW-hOk48_%2F-MG3NODeE_lVZxpd8j0f%2Fimage.png?alt=media\&token=3d775edb-29b6-4814-87b9-7ea89b6ca01f)

And finally select Nobe OmniScope plugin in the list and set the options as follows:

![](https://565437294-files.gitbook.io/~/files/v0/b/gitbook-legacy-files/o/assets%2F-MFqn5MuayPgQPMZ9pwf%2F-MG3NEHwb8vEW-hOk48_%2F-MG3NRr6olBjXBWx2z7X%2Fimage.png?alt=media\&token=f62e0e96-996d-4d59-9e22-76c46d41dee8)

**Make sure** the Channel 1 is enabled! Otherwise the signal will remain black in OmniScope.

Once the setup is done you can now connect from OmniScope using Assimilate Scratch source.


# Final Cut Pro X

How to use OmniScope with Final Cut Pro X

1. You will want to install the free NDI tools for Mac: <https://downloads.ndi.tv/Tools/NDIToolsInstaller.pkg>
2. Configure NDI settings in macOS
   1. Open your Mac's System Preferences and select NDI Output
   2. Set the Video Format to match your Final Cut Pro project
   3. Set the Frame Rate to match your Final Cut Pro project\
      \
      ![](https://565437294-files.gitbook.io/~/files/v0/b/gitbook-x-prod.appspot.com/o/spaces%2F-MFqn5MuayPgQPMZ9pwf%2Fuploads%2FmCvGiye5jvD2AutObGFX%2FCleanShot%202023-10-10%20at%2022.18.17%402x.png?alt=media\&token=e5bb04d2-8c0c-4403-88a6-bc484beea430)
3. Launch Final Cut Pro and open Preferences
   1. Select the Playback tab and under A/V Output ensure NDI is selected, then close the Preferences window
   2. Select Window in the menu bar and click A/V Output to enable NDI output Final Cut Pro is now sending out an NDI feed which can be seen by OmniScope\
      \
      ![](https://565437294-files.gitbook.io/~/files/v0/b/gitbook-x-prod.appspot.com/o/spaces%2F-MFqn5MuayPgQPMZ9pwf%2Fuploads%2FaEpVrS4t2lxzNXjH3ews%2FCleanShot%202023-10-10%20at%2022.20.06.png?alt=media\&token=97414d84-a220-404a-9dad-53bfbf75891e)
4. Launch OmniScope: NDI input sources are automatically displayed in the "Connect to" dialog boxes within the application and no other configuration is needed.\
   \
   ![](https://565437294-files.gitbook.io/~/files/v0/b/gitbook-x-prod.appspot.com/o/spaces%2F-MFqn5MuayPgQPMZ9pwf%2Fuploads%2FvzFs6VtrwmqqWczS6YwT%2FCleanShot%202023-10-10%20at%2022.22.31.png?alt=media\&token=2b162ecd-70bb-4a27-918d-b6731b2c6126)

{% hint style="info" %}
On macOS Sonoma you will need to follow these steps to make NDI visible in the A/V output in FCPX:\
:link: <https://ndi.video/faq/mac-os-sonoma-no-longer-recognizes-ndi-tools-as-a-virtual-camera/>
{% endhint %}


# Syphon

Direct GPU frame sharing

Syphon is a macOS only technology to share GPU frames between processes.

The list of supported applications is growing constantly and can be checked at the project website: <http://syphon.v002.info/>


# Screen Capture

Screen Capture allows you to monitor images and videos directly from the screen. Use it with photo-editing apps like Photoshop, Lightroom, or Capture One, or to monitor video sources like YouTube or Vimeo directly.

{% hint style="info" %}
In 1.11.25+, OmniScope defaults to ScreenCaptureKit on macOS 12.3+ and Windows Graphics Capture on Windows 10/11. You can switch drivers in Input Settings if needed.
{% endhint %}

Once the Screen Capture is connected, you can select the source monitor and configure the frame rate in the **Input Settings**:

<figure><img src="https://565437294-files.gitbook.io/~/files/v0/b/gitbook-x-prod.appspot.com/o/spaces%2F-MFqn5MuayPgQPMZ9pwf%2Fuploads%2Fgit-blob-44a4e3680beedce93c539b62f2c2ff97a66a6853%2F2026-02_screen_capture.jpg?alt=media" alt=""><figcaption><p>Screen Capture input settings</p></figcaption></figure>

To limit the captured area to the monitored image only, use the [**Crop**](/nobe-omniscope/features/crop) feature — **View > Crop** or **Alt+C**:

<figure><img src="https://565437294-files.gitbook.io/~/files/v0/b/gitbook-x-prod.appspot.com/o/spaces%2F-MFqn5MuayPgQPMZ9pwf%2Fuploads%2Fgit-blob-646e2f85dfbce813a0bac1efaa089ad0db8464c7%2F2026-02_screen_capture_crop.jpg?alt=media" alt=""><figcaption><p>Crop the captured area</p></figcaption></figure>

On current Windows builds, Crop also affects scopes correctly when the input uses **Windows Graphics Capture**.

### Troubleshooting

#### macOS Permissions

If you don't see an image on macOS, make sure OmniScope has **Screen Recording** permission:

<img src="https://565437294-files.gitbook.io/~/files/v0/b/gitbook-x-prod.appspot.com/o/spaces%2F-MFqn5MuayPgQPMZ9pwf%2Fuploads%2FTgUs9Ec1wLqrtS0Oieg3%2FCleanShot%202022-07-08%20at%2009.17.47%402x.png?alt=media&amp;token=ddc14626-aef9-41f6-9a47-e38b014a2864" alt="" data-size="original">

#### Capture driver

{% hint style="info" %}
Screen capture driver defaults can be changed if compatibility issues appear.
{% endhint %}

If screen capture doesn't work as expected, you can change the capture driver in **Input Settings**:

<figure><img src="https://565437294-files.gitbook.io/~/files/v0/b/gitbook-x-prod.appspot.com/o/spaces%2F-MFqn5MuayPgQPMZ9pwf%2Fuploads%2Fgit-blob-a2484bc715ef1b4875afaf934cae6849208e0fe4%2F2026-02_screen_capture_driver.jpg?alt=media" alt=""><figcaption><p>Screen capture driver settings</p></figcaption></figure>

If Crop updates the overlay but scopes still analyze the full frame on Windows, update OmniScope to a build that includes the Windows Graphics Capture crop fix or switch to **ScreenCaptureWinDX11** as a temporary workaround.

***

If you are using older OmniScope version, you can change this in the config file:

1. Go to Options / Open Logs
2. Close OmniScope
3. Edit file config\_1\_19.json
4. Find a line:\
   "screencapture\_type": "**ScreenCaptureWinDX9**",\
   And change it to:\
   "screencapture\_type": "**ScreenCaptureWinDX11**",
5. Save the file & restart OmniScope

There are several options that can be used for **screencapture\_type:**

**Windows:**

1. **ScreenCaptureWinWGC** - Windows Graphics Capture (default in 1.11.25+ on Windows 10/11)
2. **ScreenCaptureWinDX11** - GPU accelerated using DirectX 11 (low latency, recommended on older Windows 10)
3. **ScreenCaptureWinDX9** - GPU accelerated using DirectX 9 (most compatible, recommended on Windows 8 and older)
4. **ScreenCaptureWinGDI** - without GPU acceleration (safe fallback if the above don't work, but it is the slowest option)

**macOS:**

1. **ScreenCaptureKit** - Modern macOS capture API (default in 1.11.25+ on macOS 12.3+)
2. **ScreenCaptureMac** - Legacy capture (compatible with older macOS versions)


# Image File

Image File source supports common still-image formats, including JPEG, PNG, TIFF, HEIC, WebP, EXR, and DPX.

On macOS, 16-bit TIFF files retain their full precision when loaded in OmniScope 1.11.55 and later.


# Video File

Video File source lets you load local media files and analyze playback with OmniScope scopes and QC tools.

## Playback Controls

After connecting a Video File source, use the source options to:

* Play / pause
* Scrub position
* Loop playback

The **Playback Controls** visibility setting is saved per input and remains in effect after reconnecting the source or restarting OmniScope.

When the video source is selected, press the **Left Arrow** or **Right Arrow** key to pause and step backward or forward by one frame. This also works with the FFmpeg reader in OmniScope 1.11.55 and later.

<figure><img src="https://565437294-files.gitbook.io/~/files/v0/b/gitbook-x-prod.appspot.com/o/spaces%2F-MFqn5MuayPgQPMZ9pwf%2Fuploads%2Fgit-blob-2516f2be5e5cbb21fdec26a65c8a694a934addac%2F2026-02_playback_controls.jpg?alt=media" alt=""><figcaption><p>Video file playback controls</p></figcaption></figure>

## Free Run Mode

Free run mode bypasses source FPS and real-time pacing, delivering frames as fast as the processing pipeline can accept them. This is useful for offline analysis, batch QC, or exporting where real-time playback speed is not required.

### Enabling Free Run

1. Select the video file source in the **Input Strip**.
2. Open the **Settings** tab in the source panel.
3. Under **Free run**, check **Enabled**.

<figure><img src="https://565437294-files.gitbook.io/~/files/v0/b/gitbook-x-prod.appspot.com/o/spaces%2F-MFqn5MuayPgQPMZ9pwf%2Fuploads%2Fgit-blob-7682fca8a8626fe3ea2506471bd6799d8c263c5b%2F2026-04_free_run_settings.jpg?alt=media" alt=""><figcaption><p>Free run option in Input Settings</p></figcaption></figure>

### Speed Indicator

When free run is active, a real-time speed multiplier (e.g. **9x**) is displayed above the source viewer area, showing how much faster than real-time the file is being processed.

<figure><img src="https://565437294-files.gitbook.io/~/files/v0/b/gitbook-x-prod.appspot.com/o/spaces%2F-MFqn5MuayPgQPMZ9pwf%2Fuploads%2Fgit-blob-19be6616d390c2d4cfc22cbb62c6a910b414571b%2F2026-04_free_run_speed_indicator.jpg?alt=media" alt=""><figcaption><p>Speed indicator showing playback rate relative to real-time</p></figcaption></figure>

{% hint style="info" %}
Free run is available for all file-based sources (Video File on macOS and Windows) in **1.11.43+**.
{% endhint %}

## Reader Selection

On macOS and Windows, OmniScope can use different decoding backends for local video files.

Open **Preferences > Video file playback** and choose **Video file reader**:

* **Auto**: prefers the native system decoder when supported, otherwise falls back to FFmpeg
* **AVFoundation** on macOS or **Media Foundation** on Windows: native decoding path
* **FFmpeg**: software fallback for formats the native reader cannot open reliably

On Windows, the **Video file playback** preference is available in release builds in **1.11.44+**.

## Audio Support

{% hint style="info" %}
Audio from video files is supported on macOS and Windows in **1.11.25+**.
{% endhint %}

Use the Audio Meter scope to verify levels during playback.

In OmniScope 1.11.54 and later, seeking or repeating playback resets loudness measurements and held peaks so they reflect the new playback position.

## Sync and Playback Notes

{% hint style="info" %}
A/V sync behavior for video playback and looping was improved in **1.11.25**. macOS GPU playback was improved in **1.11.24**.
{% endhint %}

In **1.11.54**, Windows video decoding and conversion stay on the GPU when supported, improving 4K playback performance with scopes and QC enabled.

In **1.11.55**, FFmpeg playback was updated to keep the latest requested position during rapid scrubbing, improve seek accuracy for H.264, HEVC, and ProRes files, and include delayed frames at the end of a clip.

## Troubleshooting

### No audio from file playback

* Confirm the file contains an audio track.
* Check source audio settings and monitor scopes.
* In **Preferences > Video file playback**, try switching **Video file reader** between **Auto**, the native reader, and **FFmpeg**.
* Try another file to rule out codec/container issues.

### Playback stutter

* Reduce active scopes or QC load.
* Use local SSD storage for large files.
* Lower playback resolution if needed.


# SRT Stream

OmniScope supports **real-time monitoring of live SRT video streams**.

Select **“SRT”** in the **Connect to** dialog and paste in your stream URL to start analyzing remote feeds with **low-latency** and **secure transmission**—perfect for remote grading, live production, and distributed teams.


# FFmpeg Stream

OmniScope supports **real-time monitoring of video delivered via FFmpeg** over UDP or named pipe, using the NUT container format.

The **FFmpeg Stream** source (previously two separate sources — *UDP/NUT* and *Pipe/NUT*) is a unified input that auto-detects the connection type from the URL you provide:

| URL format             | Behavior                                                   |
| ---------------------- | ---------------------------------------------------------- |
| `udp://…`              | UDP socket; NUT container forced (FFmpeg cannot probe UDP) |
| `\\.\pipe\…` (Windows) | Named pipe via NUT bridge                                  |
| Other paths / URLs     | Auto-detect container format                               |

{% hint style="info" %}
**SRT Stream** remains a separate, dedicated source type optimized for low-latency secure streaming. Use FFmpeg Stream for UDP and pipe-based workflows.
{% endhint %}

## Connecting via UDP

1. Open OmniScope and go to **Input > Connect to…**
2. Select **FFmpeg Stream**
3. Enter a `udp://` URL, for example:

   ```
   udp://0.0.0.0:5000
   ```
4. Click **Connect**

When a UDP URL is detected, advanced UDP options are shown (packet size, FIFO size, etc.).

## Connecting via Named Pipe (Windows)

Named-pipe transport requires a small Python relay script — the **NUT bridge** — that sits between your FFmpeg sender and OmniScope.

### Prerequisites

* Python 3.x with `pywin32`: `pip install pywin32`
* FFmpeg in PATH

### Step 1 — Start the NUT bridge

```bash
python nut_bridge.py
```

The bridge creates two pipes and waits for connections:

* `\\.\pipe\ffmpeg_in` — FFmpeg writes here
* `\\.\pipe\ffmpeg_out` — OmniScope reads here

### Step 2 — Send video to the bridge

```bash
# Remux without re-encoding (fastest, preserves quality):
ffmpeg -i input.mov -c copy -f nut \\.\pipe\ffmpeg_in

# From a capture device:
ffmpeg -f dshow -i video="My Webcam" -c:v libx264 -f nut \\.\pipe\ffmpeg_in

# From an RTMP stream:
ffmpeg -i rtmp://server/live/stream -c copy -f nut \\.\pipe\ffmpeg_in
```

### Step 3 — Connect OmniScope

1. Go to **Input > Connect to…** and select **FFmpeg Stream**
2. Enter the pipe path: `\\.\pipe\ffmpeg_out` (pre-filled by default)
3. Click **Connect**

### Hot-connect

The NUT bridge supports connecting and reconnecting at any time:

* OmniScope can join **after** the sender is already streaming — the bridge replays the NUT header to synchronize
* The sender can restart without disconnecting OmniScope
* OmniScope can disconnect and reconnect; the bridge handles this gracefully

To stop: terminate the Python script (Ctrl+C) — the pipes are removed automatically.

## Why NUT container?

NUT is ideal for pipe and UDP transport because:

* **Low overhead** — minimal container framing
* **Simple header** — can be captured and replayed for mid-stream joins
* **Codec-agnostic** — supports any codec FFmpeg knows
* **No index required** — unlike MP4/MKV, no seek table needed
* **Byte-stream friendly** — designed for streaming scenarios where seeking is not possible

## Migrating from UDP/NUT or Pipe/NUT

If you previously used the separate **UDP/NUT** or **Pipe/NUT** source types, your saved configurations are automatically migrated to **FFmpeg Stream** on first load. No manual changes are needed.

## Related

* [SRT Stream](/nobe-omniscope/sources/srt-stream) — Low-latency secure streaming
* [NDI®](/nobe-omniscope/sources/ndi-r) — Network Device Interface source
* [Multiple Input Sources](/nobe-omniscope/sources/multiple-input-sources) — Use several sources simultaneously


# System Video Input

System Video Input lets OmniScope use OS-level capture devices such as webcams and USB capture hardware.

## Supported Devices

| Device Type       | Examples                                 |
| ----------------- | ---------------------------------------- |
| Webcams           | Built-in cameras, Logitech, Razer        |
| USB Capture Cards | AJA U-TAP, Elgato Cam Link, Magewell     |
| HDMI/SDI to USB   | Blackmagic Web Presenter, Atomos Connect |
| Virtual Cameras   | OBS Virtual Camera, NDI Virtual Input    |

## Platform Notes

### macOS

OmniScope uses AVFoundation-based system capture.

Since 1.11.25, USB capture on macOS was rewritten with better hot-plug handling and synchronized audio support. In 1.11.37, audio monitoring for USB capture devices (e.g. AJA U-Tap) was further improved to stay in sync with live video cadence, avoiding missing, looped, or malformed audio.

### Windows

Since 1.11.25, Windows system capture supports a DirectShow path for broader USB device compatibility and improved MJPEG capture behavior.

## USB Driver Choice (Windows)

In **Options > Preferences > Sources**, choose the USB capture driver:

* **Media Foundation**
* **DirectShow**

Changing this setting requires an app restart.

## Audio Support

{% hint style="info" %}
**1.11.25+** - USB input audio is supported on both macOS and Windows.
{% endhint %}

For devices with embedded or associated audio:

1. Select the video device.
2. Confirm the audio source in input settings.
3. Use the Audio Meter scope to verify levels.

### System Audio Capture

You can also capture system audio from your computer output:

1. Open input settings.
2. Enable **System Audio**.
3. Choose the audio output/source to monitor.

## Troubleshooting

### Device not listed

* Reconnect the device and verify OS detection.
* Close other apps that may hold exclusive access.
* Check camera permissions on macOS.
* Check Device Manager on Windows.

### No audio

* Confirm the device actually carries audio.
* Verify selected audio source in input settings.
* Check OS-level microphone/audio permissions.

### Unstable performance

* Lower resolution or frame rate.
* Prefer USB 3.0+ ports.
* Use vendor-native integrations (DeckLink/AJA) for high-end workflows.

## Related

* [Screen Capture](/nobe-omniscope/sources/screen-capture)
* [DeckLink & UltraStudio](/nobe-omniscope/sources/decklink-and-ultrastudio)
* [AJA](/nobe-omniscope/sources/aja)


# Signal Generator

The Signal Generator creates synthetic test patterns for calibration, testing, and demonstration purposes. It's useful when you need a consistent reference signal without external hardware.

## Overview

OmniScope includes a GPU-based signal generator that can produce various test patterns:

* SMPTE color bars
* Grayscale ramps
* Resolution charts
* Custom patterns

This is useful for:

* Testing scope functionality
* Calibrating displays
* Demonstrating OmniScope features
* Verifying signal paths

## Connecting

1. Open OmniScope
2. Go to **Input** menu > **Connect to...**
3. Select **Signal Generator**
4. Choose your desired test pattern

## Available Patterns

### SMPTE Color Bars

Standard SMPTE color bar pattern used for broadcast calibration. Includes:

* 75% and 100% color bars
* PLUGE (Picture Line-Up Generation Equipment) pattern
* Reference white and black

For broadcast-legal waveform positions, switch the generator to **Video** range and make sure **Scale the video/SDI range to the full range** is disabled in OmniScope. The default full-range mode is intended for full-domain testing, so white and black sit at full-range endpoints.

### Grayscale Ramp

Linear grayscale gradient for checking gamma and contrast:

* Smooth transitions from black to white
* Useful for verifying waveform linearity

### Resolution Chart

High-frequency patterns for checking resolution and sharpness:

* Line pairs at various frequencies
* Corner-to-corner sharpness verification

### Video Signal Tester

Comprehensive test pattern by Thomas Berglund featuring:

* Color bars with various saturation levels
* Grayscale steps
* Resolution patterns
* Safe area markers

{% hint style="info" %}
The Video Signal Tester pattern was contributed by Thomas Berglund. Thank you!
{% endhint %}

## Settings

| Setting    | Description                                                                                | Default    |
| ---------- | ------------------------------------------------------------------------------------------ | ---------- |
| Pattern    | Which test pattern to generate                                                             | SMPTE Bars |
| Resolution | Output resolution                                                                          | 1920x1080  |
| Frame Rate | Output frame rate — choose from common rates (23.98, 24, 25, 29.97, 30, 50, 59.94, 60 fps) | 30 fps     |
| Bit Depth  | Signal bit depth                                                                           | 10-bit     |

## Use Cases

### Scope Calibration

Use color bars to verify your scopes are displaying accurate values:

* 75% bars should read at specific vectorscope positions
* White should reach 100 IRE on the waveform
* Black should sit at 0 IRE (or 7.5 IRE for NTSC setup)

### Display Calibration

Output test patterns to external monitors via SDI Out to calibrate:

* Brightness and contrast using PLUGE
* Color accuracy using color bars
* Gamma using grayscale ramps

### Demonstrations

When demonstrating OmniScope, the signal generator provides a consistent, reliable source without needing external hardware.

## Tips

* Use 10-bit output for most accurate testing
* The signal generator is GPU-based for low CPU usage
* Combine with SDI Out to send patterns to external displays

## Related

* [SDI Out](/nobe-omniscope/live-pack-add-on/sdi-out) - Output test patterns to external devices
* [Waveform](/nobe-omniscope/scopes/waveform) - Analyze generated patterns
* [Vectorscope](/nobe-omniscope/scopes/vectorscope) - Verify color bar accuracy


# Spout

{% hint style="info" %}
**Windows only** - Spout is a Windows-specific technology for GPU texture sharing.
{% endhint %}

Spout allows OmniScope to receive video directly from other applications via GPU texture sharing on Windows. This provides the lowest possible latency as frames are shared directly on the GPU without CPU copying.

## Overview

Spout is the Windows equivalent of Syphon on macOS. It enables:

* Zero-copy GPU frame sharing between applications
* Ultra-low latency monitoring
* Direct integration with creative applications
* Real-time color grading workflows

## Requirements

* Windows 10 or later
* DirectX 11 compatible GPU
* Spout-compatible sender application

## Supported Applications

Many creative applications support Spout output:

* **DaVinci Resolve** (via third-party plugins)
* **After Effects** (via Spout plugins)
* **TouchDesigner**
* **Notch**
* **Unreal Engine**
* **Unity**
* **OBS Studio** (with Spout plugin)
* **vvvv**
* **Processing**

## Setup

### Connecting to a Spout Source

1. Ensure the sending application is running and outputting via Spout
2. In OmniScope, go to **Input** menu
3. Select **Spout**
4. Choose the Spout sender from the dropdown list

### Settings

| Setting     | Description                      | Default     |
| ----------- | -------------------------------- | ----------- |
| Sender      | The Spout source to receive from | Auto-detect |
| Color Space | Input color space interpretation | sRGB        |

## DirectX 11 Mode

OmniScope 1.11.25 adds improved DirectX 11 Spout support for even better performance:

* Direct GPU texture sharing without format conversion
* Lower latency than OpenGL-based Spout
* Better compatibility with DirectX-based applications

To use DirectX 11 mode, ensure OmniScope is running with the DirectX 11 backend.

## How It Works

1. The sender application renders frames to a shared GPU texture
2. Spout creates a handle that can be accessed by other applications
3. OmniScope receives the texture handle and reads directly from GPU memory
4. No CPU-side copying occurs, minimizing latency

## Performance

Spout provides the best possible performance for local application monitoring:

| Aspect     | Performance                |
| ---------- | -------------------------- |
| Latency    | Sub-frame (< 1ms overhead) |
| CPU Usage  | Minimal                    |
| GPU Usage  | Shared with sender         |
| Resolution | Up to 8K+                  |

## Troubleshooting

### No Spout Sources Visible

1. Verify the sender application is running and outputting via Spout
2. Check that both applications are using compatible DirectX/OpenGL modes
3. Restart OmniScope to refresh the sender list
4. Ensure no firewall is blocking Spout communication

### Black or Corrupt Image

1. Check color space settings match the sender
2. Verify GPU drivers are up to date
3. Try switching between DirectX and OpenGL modes in the sender
4. Restart both applications

### High Latency

1. Ensure you're using DirectX 11 mode if available
2. Check that V-Sync is disabled in the sender if low latency is critical
3. Verify GPU is not overloaded with other tasks

## Tips

* Spout sources update in real-time; use OmniScope's frame rate display to verify smooth reception
* Multiple OmniScope instances can receive from the same Spout sender
* Spout works alongside other OmniScope inputs (you can monitor Spout and SDI simultaneously)
* For the lowest latency, use DirectX 11 mode in both sender and receiver

## Related

* [Syphon](/nobe-omniscope/sources/syphon) - macOS equivalent for GPU texture sharing
* [NDI Input](/nobe-omniscope/sources/ndi-r) - Network-based video sharing
* [Screen Capture](/nobe-omniscope/sources/screen-capture) - Capture any application window


# Multiple Input Sources

How to connect more than one input source at a time

Nobe OmniScope allows you to connect more than one active source at a time.

The easiest way to do this is to enable the **Input Strip** from the **View** menu:

<figure><img src="https://565437294-files.gitbook.io/~/files/v0/b/gitbook-x-prod.appspot.com/o/spaces%2F-MFqn5MuayPgQPMZ9pwf%2Fuploads%2Fgit-blob-54ef85b8bfb22999c9b2e126505762a7cfb14e40%2F2026-02_show_input_strip.jpg?alt=media" alt=""><figcaption><p>Show Input Strip</p></figcaption></figure>

Once visible, you can dock the Input Strip into your workspace. It works in both horizontal and vertical orientation:

<figure><img src="https://565437294-files.gitbook.io/~/files/v0/b/gitbook-x-prod.appspot.com/o/spaces%2F-MFqn5MuayPgQPMZ9pwf%2Fuploads%2Fgit-blob-63038193de94680228144553a71acb363e61560d%2F2026-02_input_strip.jpg?alt=media" alt=""><figcaption><p>Input Strip</p></figcaption></figure>

The Input Strip provides the following controls:

1. **Disconnect** button (top-right corner) — disconnects that source
2. **Input Source Settings** (lower-right corner) — opens settings for the selected source

To connect an additional source, right-click an empty slot in the Input Strip and select the input type from the context menu:

<figure><img src="https://565437294-files.gitbook.io/~/files/v0/b/gitbook-x-prod.appspot.com/o/spaces%2F-MFqn5MuayPgQPMZ9pwf%2Fuploads%2Fgit-blob-161b0a978dea749831c4f0d00ed2547de83738dd%2F2026-02_input_strip_connect.jpg?alt=media" alt=""><figcaption><p>Connect a new source from the Input Strip</p></figcaption></figure>

Once added, the new source appears as a thumbnail in the Input Strip:

<figure><img src="https://565437294-files.gitbook.io/~/files/v0/b/gitbook-x-prod.appspot.com/o/spaces%2F-MFqn5MuayPgQPMZ9pwf%2Fuploads%2Fgit-blob-2f94f693d7d7d99bf16225ae968f75b526b7ab0f%2F2026-02_input_strip_multi.jpg?alt=media" alt=""><figcaption><p>Multiple active input sources</p></figcaption></figure>

To assign a source to a specific scope, right-click the scope view and go to **Input Device** to select from the list of available sources:

<figure><img src="https://565437294-files.gitbook.io/~/files/v0/b/gitbook-x-prod.appspot.com/o/spaces%2F-MFqn5MuayPgQPMZ9pwf%2Fuploads%2Fgit-blob-2dd9227fb4274aa845c580e1c8282e8bcb0e8f98%2F2026-02_input_source_select.jpg?alt=media" alt=""><figcaption><p>Select the active input for a scope</p></figcaption></figure>

Input sources are **color coded** — when you hover over a thumbnail in the Input Strip, a colored frame highlights all scopes assigned to that source.

## Auto-connect

You can configure sources to reconnect automatically on startup. Right-click a connected source thumbnail and select **Auto-connect**:

<figure><img src="https://565437294-files.gitbook.io/~/files/v0/b/gitbook-x-prod.appspot.com/o/spaces%2F-MFqn5MuayPgQPMZ9pwf%2Fuploads%2Fgit-blob-efa59f1d92c193372e6a51c5cf603d910865a415%2F2026-02_input_strip_autoconnect.jpg?alt=media" alt=""><figcaption><p>Auto-connect setting in the Input Strip</p></figcaption></figure>

For more details, see [Auto-connect](/nobe-omniscope/settings-and-preferences/auto-connect).


# Scopes

Scope types available in Nobe OmniScope

Scopes are dockable panels that can be arranged in tabs and saved in layouts.

## Scope UI

* Each scope tab includes a hamburger menu (1.11.25+) for quick access to settings and context actions.
* The tab bar can display status text (1.11.25+) such as scale, zoom, or other scope-specific information.
* Right-click a scope tab to move it between windows or access context actions.


# Source Signal

The Source Signal scope displays a live preview of the input video. It doubles as the primary inspection tool — zoom into pixels, read color values, reveal faint neutral casts with Chroma Boost, overlay zebras and focus peaking, isolate channels, and compare snapshots.

<figure><img src="https://565437294-files.gitbook.io/~/files/v0/b/gitbook-x-prod.appspot.com/o/spaces%2F-MFqn5MuayPgQPMZ9pwf%2Fuploads%2Fgit-blob-3197871c2787a1efae151b1a27a1cdc7cdd4ec01%2F2026-02_source-signal.jpg?alt=media" alt=""><figcaption><p>Source Signal scope with color picker pins</p></figcaption></figure>

## Signal Information

Enable **Show signal information** under **Overlays** to place a large, bold input-status readout over the image. For a connected signal, it shows the input and source name, resolution, progressive/interlaced format, frame rate, pixel format, signal range, primaries, and transfer function. It also reports connection states such as **Connecting**, **Not connected**, or **No signal**.

Use **Signal information text size** to adjust the overlay. The setting and text size are saved with the layout. Signal information is not shown when the scope is displaying a snapshot override.

## Zoom & Pan

Zoom up to **15×** and pan freely across the image — the same controls used in professional image editors.

| Input                       | Action                           |
| --------------------------- | -------------------------------- |
| **Mouse wheel**             | Zoom in/out (centered on cursor) |
| **Space + Left-click drag** | Pan the zoomed view              |
| **Middle-click**            | Reset zoom to 1× and center      |

A **mini-preview** thumbnail appears in the top-right corner while zoomed, showing a yellow rectangle for the current viewport. Toggle it with the **Show zoom preview** setting.

<figure><img src="https://565437294-files.gitbook.io/~/files/v0/b/gitbook-x-prod.appspot.com/o/spaces%2F-MFqn5MuayPgQPMZ9pwf%2Fuploads%2Fgit-blob-d9bf031e61fa77ad8e243d4d11f002974518afe4%2F2026-02_source-signal-zoom-pan.jpg?alt=media" alt=""><figcaption><p>Zoomed view with mini-preview thumbnail</p></figcaption></figure>

Zoom & Pan is also available in the [False Color](/nobe-omniscope/scopes/false-color) and [Skintone Scope](/nobe-omniscope/scopes/skintone-scope).

## Channel Isolation

Solo individual color channels for quick inspection of noise, spill, or exposure per channel.

| Channel                | Description                           |
| ---------------------- | ------------------------------------- |
| **RGB**                | Full color (default)                  |
| **Red / Green / Blue** | Single channel displayed as grayscale |
| **Luma**               | Luminosity (Rec. 709 weighted)        |

When a mask is active, the **Draw masks in RGB** option forces the mask overlay to display in full color even when a single channel is soloed.

<figure><img src="https://565437294-files.gitbook.io/~/files/v0/b/gitbook-x-prod.appspot.com/o/spaces%2F-MFqn5MuayPgQPMZ9pwf%2Fuploads%2Fgit-blob-a4dafccfcd97651b4b2abd5105eecb34ecff3c0d%2F2026-02_source-signal-channels.jpg?alt=media" alt=""><figcaption><p>Blue channel isolation</p></figcaption></figure>

## Color Picker

Hold **Alt** to activate the color picker, or enable **Always show** in settings. Click to place persistent **color pins** (up to 30) anywhere on the image.

| Input                                       | Action                                                                  |
| ------------------------------------------- | ----------------------------------------------------------------------- |
| **Alt** (hold)                              | Show color picker                                                       |
| **Click** (with picker)                     | Place a color pin                                                       |
| **Shift + Click**                           | Copy HEX value to clipboard                                             |
| **Ctrl + Click**                            | Add value as a [global target](/nobe-omniscope/features/global-targets) |
| **Middle-click** or **Double-click** on pin | Remove pin                                                              |

### Picker formats

RGB 8-bit · RGB 10-bit · RGBY · RGB float · HEX · CMYK · HSV · Nits · CIE xy (input)

**CIE xy (input)** reports input-referred CIE 1931 chromaticity through the active input color-space transform. It averages XYZ across the selected sampling area before calculating xy, shows four decimal places, and reports unavailable values for black or invalid samples. Pins and clipboard copying use the same xy result.

### Picker options

| Setting                  | Description                                                                    |
| ------------------------ | ------------------------------------------------------------------------------ |
| **Source**               | Input Source, Rescaled Source, or Working Signal                               |
| **Sampling area**        | 1×1, 3×3, 5×5, 7×7, or 9×9 pixels                                              |
| **Picker readout range** | For RGB formats, choose Source values, Decoded RGB, Video range, or Full range |
| **Monochromatic**        | Render picker overlay in grayscale                                             |
| **Show on hover only**   | Hide the readout until the pointer moves                                       |

The readout-range setting changes displayed numbers only; it does not change source decoding or scope processing. With **Input Source**, Source values preserve the reconstructed native RGB or YCbCr domain. Video range maps black and white to 16/235 at 8-bit or 64/940 at 10-bit while preserving below-black and above-white excursions.

## Data Analyser

A **17×11 pixel grid** that shows individual code values around a chosen position. Drag to reposition the analyser area on the image.

<figure><img src="https://565437294-files.gitbook.io/~/files/v0/b/gitbook-x-prod.appspot.com/o/spaces%2F-MFqn5MuayPgQPMZ9pwf%2Fuploads%2Fgit-blob-1eb3f2f3db12188d99bf5ec9cfef1ad468c223ed%2F2026-02_source-signal-data-analyser.jpg?alt=media" alt=""><figcaption><p>Data Analyser showing 10-bit code values</p></figcaption></figure>

| Setting                    | Description                                                                 |
| -------------------------- | --------------------------------------------------------------------------- |
| **Format**                 | 8-bit, 10-bit, 12-bit, 32-bit float, Nits, Nits per channel                 |
| **Source**                 | Input Source, Rescaled Source, or Working Signal                            |
| **Analyser readout range** | Source values, Decoded RGB, Video range, or Full range for non-Nits formats |
| **Font size**              | Small or large                                                              |

The status bar at the bottom shows the video data type (RGB/YCbCr), format, line number, and sample number.

As with the picker, the analyser readout range only changes how sampled values are displayed. Source values are reconstructed from the decoded signal; they are not bit-exact packed or subsampled capture values.

See also: [Data Analyser (QC)](/nobe-omniscope/qc/data-analyser)

## Focus Peaking

Edge-detail overlay that highlights in-focus areas. Requires **Live Pack**.

<figure><img src="https://565437294-files.gitbook.io/~/files/v0/b/gitbook-x-prod.appspot.com/o/spaces%2F-MFqn5MuayPgQPMZ9pwf%2Fuploads%2Fgit-blob-e3f0f41c36d3cc039fce209f24a43fa37ebea533%2F2026-02_source-signal-focus-peaking.jpg?alt=media" alt=""><figcaption><p>Focus Peaking in Regular mode</p></figcaption></figure>

| Setting        | Description                                                                                                                               |
| -------------- | ----------------------------------------------------------------------------------------------------------------------------------------- |
| **Mode**       | **Regular** — colored edges over the image · **Edges** — enhanced white edges on black · **Enhanced Edges** — binary white edges on black |
| **Threshold**  | Edge sensitivity (0–100 %)                                                                                                                |
| **Peak color** | Color used for the Regular mode highlight (default: red)                                                                                  |

See also: [Focus Peaking (Live Pack)](/nobe-omniscope/live-pack-add-on/focus-peaking)

## Chroma Boost

Available in version **1.11.33+**.

**Chroma Boost** is a preview-only inspection aid that amplifies subtle color differences in low-saturation areas. Use it to spot faint green, magenta, or blue contamination in whites, grays, walls, fabrics, skin-adjacent neutrals, and other nearly neutral surfaces.

Unlike a global saturation control, Chroma Boost is strongest near neutral colors and tapers off as saturation increases, so already colorful parts of the image stay more stable.

<figure><img src="https://565437294-files.gitbook.io/~/files/v0/b/gitbook-x-prod.appspot.com/o/spaces%2F-MFqn5MuayPgQPMZ9pwf%2Fuploads%2Fgit-blob-74131eefdd635ecec3deb0ed065cd9703d2c347d%2F2026-03_chroma-boost.jpg?alt=media" alt=""><figcaption><p>Chroma Boost amplifies subtle color differences in near-neutral areas</p></figcaption></figure>

| Setting          | Description                                                                                                           |
| ---------------- | --------------------------------------------------------------------------------------------------------------------- |
| **Chroma Boost** | Enable or disable the inspection mode. Also available from the Source Signal right-click menu.                        |
| **Amount**       | Controls how strongly low-saturation colors are amplified. Start low for subtle checks and increase only when needed. |

### What it affects

* **Source Signal preview only**
* **Does not** modify the source signal
* **Does not** affect scopes, QC measurements, outputs, or recordings

When enabled, the Source Signal tab shows a **Chroma Boost** status badge so it is easy to see that the viewer is in a temporary inspection mode.

## Zebra Overlays

Diagonal stripe patterns warn about overexposure or illegal saturation levels.

<figure><img src="https://565437294-files.gitbook.io/~/files/v0/b/gitbook-x-prod.appspot.com/o/spaces%2F-MFqn5MuayPgQPMZ9pwf%2Fuploads%2Fgit-blob-54561d720c00bd86593afe99337a13365accd826%2F2026-02_source-signal-zebras.jpg?alt=media" alt=""><figcaption><p>Luma zebra overlay</p></figcaption></figure>

### Luma zebra

| Setting           | Description                                                                                                             |
| ----------------- | ----------------------------------------------------------------------------------------------------------------------- |
| **IRE threshold** | 0 %–110 % (default 100 %). Regions above the threshold show **black stripes**; sub-black regions show **blue stripes**. |

### Saturation zebra

Enable alongside luma zebra for additional saturation warnings:

* Saturation above **70 %** → yellow stripes
* Saturation above **99 %** → orange stripes

## Safe Area Guides

Built-in overlay guides accessible from the scope settings or right-click menu.

| Guide                        | Description                                                                                      |
| ---------------------------- | ------------------------------------------------------------------------------------------------ |
| **Title Safe / Action Safe** | Two concentric rectangles. Default: Title 90 %, Action 95 %. Configurable color and percentages. |
| **Thirds**                   | Rule-of-thirds grid with configurable color                                                      |
| **Crosshair**                | Center crosshair with configurable color                                                         |

## Custom Overlays

Load **PNG images with alpha transparency** on top of the Source Signal — safe-area guides, framing references, branding, or composition grids. Select the active overlay in the scope settings or from the [Overlays](/nobe-omniscope/features/overlays) window.

See [Overlays](/nobe-omniscope/features/overlays) for full details on managing overlays.

## HSL Range Mask

Isolate a hue/saturation/luminance range on the preview. Pixels outside the range are rendered as black.

| Setting        | Description         |
| -------------- | ------------------- |
| **Hue**        | Start/end (0–360°)  |
| **Saturation** | Start/end (0–100 %) |
| **Luminance**  | Start/end (0–100 %) |

Use **Load from mask** / **Save as mask** to sync with the global mask.

## Mask Drawing

Click and drag to draw a mask shape directly on the preview.

| Shape         | Description               |
| ------------- | ------------------------- |
| **Ellipse**   | Draw an elliptical region |
| **Rectangle** | Draw a rectangular region |

Draw modes: **Draw**, **Paint In**, **Paint Out**. A **single line** mode isolates a single scan line.

## Snapshot Compare

When a [snapshot](/nobe-omniscope/features/snapshots) is loaded, compare it against the live signal:

| Mode                | Description                                          |
| ------------------- | ---------------------------------------------------- |
| **Horizontal wipe** | Vertical divider — **W + drag** to adjust position   |
| **Vertical wipe**   | Horizontal divider — **W + drag** to adjust position |
| **Opacity blend**   | **W + drag** to adjust blend amount                  |

## Blanking Alarm

When [Blanking Detection](/nobe-omniscope/qc/blanking-detection) is enabled globally, the Source Signal draws colored bars over detected blanking regions on all four edges, with optional **blinking alert** (1-second cycle).

## Display & Color Management

| Setting                 | Description                                                                 |
| ----------------------- | --------------------------------------------------------------------------- |
| **Brightness**          | Override global brightness per scope (10–100 %)                             |
| **Monitor ICC profile** | Apply system or custom ICC profile                                          |
| **OCIO color space**    | Select input and display color spaces (requires OCIO config in Preferences) |
| **Rotate**              | Rotate the frame 90° CW or CCW                                              |
| **Flip / Mirror**       | Flip or mirror the preview                                                  |

### macOS Quick Presets

| Preset                   | Configuration                      |
| ------------------------ | ---------------------------------- |
| **Match Resolve Viewer** | Rec. 709 preview with tone-mapping |
| **Match NDI Monitor**    | Unmanaged, no ICC, no tone-mapping |

### HDR / EDR (macOS)

Enable **Display HDR** to use Apple EDR output. EDR and HDR badges appear in the top-right corner. Includes PQ (ST.2084) decode with Reinhard extended tone-mapping, luminance white point, and luminance scale controls.

## Keyboard Shortcuts

| macOS         | Windows       | Action                |
| ------------- | ------------- | --------------------- |
| Mouse wheel   | Mouse wheel   | Zoom in/out           |
| Space + drag  | Space + drag  | Pan                   |
| Middle-click  | Middle-click  | Reset zoom            |
| Alt (hold)    | Alt (hold)    | Show color picker     |
| Shift + Click | Shift + Click | Copy HEX to clipboard |
| Ctrl + Click  | Ctrl + Click  | Add as global target  |

## StreamDeck / Action Editor

| Action                      | Description                           |
| --------------------------- | ------------------------------------- |
| **SourceTogglePeaking**     | Toggle Focus Peaking                  |
| **SourceTogglePeakingLuma** | Toggle Focus Peaking + switch to Luma |
| **ClearAllPins**            | Remove all color pins                 |
| **ToggleLoupe**             | Toggle loupe magnifier                |

## Related

* [Focus Peaking (Live Pack)](/nobe-omniscope/live-pack-add-on/focus-peaking)
* [Overlays](/nobe-omniscope/features/overlays)
* [Snapshots](/nobe-omniscope/features/snapshots)
* [Global Targets](/nobe-omniscope/features/global-targets)
* [Crop](/nobe-omniscope/features/crop)
* [Data Analyser (QC)](/nobe-omniscope/qc/data-analyser)
* [Blanking Detection](/nobe-omniscope/qc/blanking-detection)


# Waveform

The Waveform scope plots signal levels vertically against the horizontal position of each pixel in the frame. Use it to judge exposure, balance channels, and spot illegal levels at a glance.

<figure><img src="https://565437294-files.gitbook.io/~/files/v0/b/gitbook-x-prod.appspot.com/o/spaces%2F-MFqn5MuayPgQPMZ9pwf%2Fuploads%2Fgit-blob-e70c3939967de6b27c5f35fadabe5efd646ad60f%2F2026-02_waveform.jpg?alt=media" alt=""><figcaption><p>Waveform scope in RGB Parade mode</p></figcaption></figure>

## Display Modes

| Mode             | Description                                                                                                                                                                                                                                   |
| ---------------- | --------------------------------------------------------------------------------------------------------------------------------------------------------------------------------------------------------------------------------------------- |
| **Luma**         | Single luma trace — a weighted sum of the **gamma-encoded** R'G'B' channels. The weights follow the active color space (Rec. 709: 0.2126 / 0.7152 / 0.0722; Rec. 2020: 0.2627 / 0.6780 / 0.0593). This is luma (Y'), not scene luminance (Y). |
| **RGB**          | R, G, B overlaid on the same area. Individual channels can be toggled on/off.                                                                                                                                                                 |
| **RGB Parade**   | R, G, B side by side with configurable spacing                                                                                                                                                                                                |
| **YRGB Parade**  | Y, R, G, B side by side                                                                                                                                                                                                                       |
| **YCbCr Parade** | Y, Cb, Cr side by side                                                                                                                                                                                                                        |

Each mode can be **colorized** — in luma mode this applies HSV-based coloring, in parade modes each channel is tinted with its own color.

> **Luma vs. luminance.** Luma (Y') is computed from the **non-linear** R'G'B' code values and is what broadcast waveform monitors have always shown. True luminance (Y) would require first linearizing the signal through its inverse EOTF. For QC against legal-range limits or relative exposure reads, luma is the correct quantity; for absolute nit measurements, use the **PQ / HLG nit scale** described below — which does decode through the inverse EOTF.

## Scale

| Scale          | Range                       |
| -------------- | --------------------------- |
| **IRE**        | 0–100                       |
| **Percentage** | 0–100 %                     |
| **8-bit**      | 0–255                       |
| **10-bit**     | 0–1023                      |
| **PQ ST 2084** | 0–10 000 nits (logarithmic) |
| **HLG**        | 0–1 000 nits (logarithmic)  |
| **mV**         | 50–700 mV                   |

The scale follows the input source by default. Enable **Scale override** in the scope settings to choose a different scale per scope.

**Legal range lines** — when enabled for a full-range signal on the 8-bit or 10-bit scale, thin dashed lines mark the narrow-range (a.k.a. video-range / "legal") code values defined by Rec. 709 / Rec. 2020: **64 and 940 in 10-bit**, **16 and 235 in 8-bit**. They are not drawn separately for video-range sources, where those boundaries already align with the displayed video scale. Values below black level or above nominal peak (but still inside the 0–1023 / 0–255 container) are legal in the *full-range* sense but may be clipped or flagged by downstream broadcast gear. See [Signal Range](/nobe-omniscope/sources/davinci-resolve-ofx/signal-range) for full-range vs. narrow-range handling in the OFX integration.

### HDR / PQ Scale

PQ and HLG scales are **absolute**: the code values are decoded through their inverse EOTF (SMPTE ST 2084 for PQ, ARIB STD-B67 for HLG) to a physical luminance in nits. A 10-bit PQ code value of 769 is **1 000 nits** regardless of the display it is eventually shown on — this is what makes HDR absolute and SDR relative.

Adjust the **Mastering Level** slider to zoom into a specific nit range. Double-click to reset to the maximum value. Reference graticules at standard HDR levels (26, 203, 1 000 nits) help align HDR deliverables — **203 nits** is the SMPTE ST 2084-A reference diffuse-white level, and **1 000 nits** is the most common mastering-display peak.

<figure><img src="https://565437294-files.gitbook.io/~/files/v0/b/gitbook-x-prod.appspot.com/o/spaces%2F-MFqn5MuayPgQPMZ9pwf%2Fuploads%2Fgit-blob-03c30d2e361d97b4e0e81974e42d68ff202dbb4a%2F2026-02_waveform-pq-scale.jpg?alt=media" alt=""><figcaption><p>Waveform with PQ ST 2084 nit scale</p></figcaption></figure>

## Trace Presentation

| Setting             | Description                                                                                                                                                                                                                                                                                                                                                                                                                                          |
| ------------------- | ---------------------------------------------------------------------------------------------------------------------------------------------------------------------------------------------------------------------------------------------------------------------------------------------------------------------------------------------------------------------------------------------------------------------------------------------------- |
| **Gain**            | Master trace brightness (1–100 %)                                                                                                                                                                                                                                                                                                                                                                                                                    |
| **Enhance Edges**   | Lifts fine detail in the trace for better visibility                                                                                                                                                                                                                                                                                                                                                                                                 |
| **True RGB colors** | Use pure red/green/blue instead of shaded trace colors                                                                                                                                                                                                                                                                                                                                                                                               |
| **True Y**          | Show the raw Y' channel from the incoming YCbCr signal instead of re-deriving luma from the RGB conversion. Only active for YCbCr sources — RGB sources are unaffected. Peak-level overlays and alert scaling stay accurate when this option is enabled. Useful when verifying a broadcast Y'CbCr deliverable that has already been chroma-subsampled, because re-deriving Y' from chroma-upsampled R'G'B' can introduce small rounding differences. |
| **Smooth Trace**    | Light temporal/post smoothing to reduce speckle noise                                                                                                                                                                                                                                                                                                                                                                                                |
| **Enhanced Render** | Use line-strip rendering instead of point rendering                                                                                                                                                                                                                                                                                                                                                                                                  |

### Highlight Trace Edges

Render colored outlines at the outermost boundaries of the waveform trace — useful for quickly spotting signal extent and comparing shots.

<figure><img src="https://565437294-files.gitbook.io/~/files/v0/b/gitbook-x-prod.appspot.com/o/spaces%2F-MFqn5MuayPgQPMZ9pwf%2Fuploads%2Fgit-blob-c464e1f6fb56cc941ed8ccc648bc3984ba6daf93%2F2026-02_waveform-highlight-trace.jpg?alt=media" alt=""><figcaption><p>Highlight trace edges showing signal boundaries</p></figcaption></figure>

| Setting            | Description                 |
| ------------------ | --------------------------- |
| **Edge thickness** | 0.5–3 px                    |
| **Edge color**     | Customizable (default: red) |

### Mark QC Luma Violations

When the [Luminosity Limit](/nobe-omniscope/qc/luminosity-limit) QC check is enabled, turn on **Mark QC luminosity violations** to render luma trace samples in red wherever they exceed the configured min/max thresholds. This gives an immediate visual indication of out-of-range levels directly on the waveform.

<figure><img src="https://565437294-files.gitbook.io/~/files/v0/b/gitbook-x-prod.appspot.com/o/spaces%2F-MFqn5MuayPgQPMZ9pwf%2Fuploads%2Fgit-blob-c859494ee7ba23d3121a4425e0b9d8b80a5fec20%2F2026-02_waveform-highlight-lum-limit.jpg?alt=media" alt=""><figcaption><p>Luma trace samples exceeding the QC limit highlighted in red</p></figcaption></figure>

Requires at least one min or max check to be active in the Luminosity Limit QC panel.

## Peak Levels

Peak level indicators show the minimum and maximum signal values for each channel as numeric readouts with horizontal marker lines.

<figure><img src="https://565437294-files.gitbook.io/~/files/v0/b/gitbook-x-prod.appspot.com/o/spaces%2F-MFqn5MuayPgQPMZ9pwf%2Fuploads%2Fgit-blob-60bba3f952aa9d0a018556f7488c112ef5cc2311%2F2026-02_waveform-peak-levels.jpg?alt=media" alt=""><figcaption><p>Peak level indicators on the waveform</p></figcaption></figure>

| Setting                     | Description                                                                                            |
| --------------------------- | ------------------------------------------------------------------------------------------------------ |
| **Show Peak Levels**        | Enable/disable the indicators                                                                          |
| **Trace-based Peak Levels** | Derive peaks from the rendered trace shape instead of image statistics (Luminosity and RGB modes only) |
| **Peak Levels color**       | Customizable line and text color                                                                       |

In parade modes, peak levels are shown per channel.

### Peak Hold (unreleased)

Enable **Peak Hold** in the waveform's context menu or under **Peak monitors** in its settings to retain the lowest and highest measured levels. A **HOLD** label distinguishes these values from current-frame readings. The waveform trace continues to update live.

For a lightning effect or similar short event:

1. Select **Luminosity** mode and the **IRE** scale.
2. Enable **Peak Hold**, which also enables **Show Peak Levels**.
3. Choose **Reset Held Peaks** immediately before the take.
4. Read the retained maximum after the effect. Reset again before the next take.

**Reset Held Peaks** is available in both the context menu and settings. Disabling Peak Hold returns to current-frame readings. Held values are kept separately for each waveform and each parade channel; they are not saved in layouts. Changing the source or measurement domain starts a fresh hold.

Peak Hold uses signal statistics, so trace-based peak settings are temporarily inactive. It accumulates samples while the waveform is being processed, rather than analyzing frames that the input or analysis pipeline skips. Keep the waveform visible throughout the take.

For Video-range sources, the peak markers and numeric readouts follow the source's actual range definition, including SDI-style legal-range mapping and any preserved below-black / above-white excursions. If **Scale the video/SDI range to the full range** is enabled, the displayed trace is expanded for viewing, but the source-aware peak math still tracks the original range correctly.

## Zoom & Pan

Zoom vertically into shadows or highlights for detailed inspection, then pan the zoomed scale to inspect a different level range.

| Input                                | Action                             |
| ------------------------------------ | ---------------------------------- |
| **Mouse wheel**                      | Zoom in/out (0.5×–20×)             |
| **Space + Left-click drag**          | Pan the zoomed waveform vertically |
| **Middle-click** or **Double-click** | Reset zoom to 1×                   |

Context-menu presets for quick zoom levels:

* **0–20 IRE** (5×) · **0–15 IRE** (7.5×) · **0–10 IRE** (10×)

Toggle between **zoom shadows** (default) and **zoom highlights** to target the range of interest. In video range mode the view automatically centers on legal black or legal white.

### Adaptive Scale

The waveform scale adapts its granularity to the current zoom level — the more you zoom in, the more intermediate scale values appear. This keeps the readout useful at every magnification without cluttering the view when zoomed out.

{% embed url="<https://timeinpixels.com/nobe-omniscope/waveform-adaptive-scale.mp4>" %}

## Custom Targets

Up to 4 per-scope reference lines at specific signal levels — useful for marking black points, white points, or exposure targets.

<figure><img src="https://565437294-files.gitbook.io/~/files/v0/b/gitbook-x-prod.appspot.com/o/spaces%2F-MFqn5MuayPgQPMZ9pwf%2Fuploads%2Fgit-blob-4868e58848b8a5690245cb20682e7fcc4b76c167%2F2026-02_waveform-custom-targets.jpg?alt=media" alt=""><figcaption><p>Custom targets with numeric labels</p></figcaption></figure>

| Per-target setting | Description                                                  |
| ------------------ | ------------------------------------------------------------ |
| **Value**          | Adapts to the current scale (IRE, 8-bit, 10-bit, nits, etc.) |
| **Color**          | Customizable per target                                      |
| **Thickness**      | 1–5 px                                                       |

Targets can be **dragged** directly on the waveform for quick repositioning.

### Global Target Sets

[Global targets](/nobe-omniscope/features/global-targets) provide a shared set of luma reference lines that appear across all waveform and parade scopes. Toggle individual targets, adjust colors and thickness, and save/recall target sets for different projects or standards.

## Filtering

| Setting                               | Description                                                                                  |
| ------------------------------------- | -------------------------------------------------------------------------------------------- |
| **Waveform Low-Pass filter**          | Horizontal box blur that softens the trace. Adjustable kernel size (0.5–20).                 |
| **Signal Low-Pass filter (EBU R103)** | Uses EBU R103 pre-filtered input. Requires the filter to be enabled globally in Preferences. |

## Broadcast Workflow Notes

Practical guidance from industry waveform/vectorscope practice:

* Use waveform as the primary legal-range check: keep most luma in the narrow range (64–940 in 10-bit) and allow only controlled specular excursions per delivery spec (EBU R103, ARIB TR-B32, SMPTE RP 2077).
* In digital workflows setup is not used; the legacy 7.5 IRE setup only applies to analog NTSC.
* For balancing, pair **RGB Parade** with the **Vectorscope**: parade for channel-level alignment (neutral balance = aligned top/bottom of the three traces), vectorscope for hue/saturation verification.
* For **HDR** deliverables, don't rely on luma alone — switch to the **PQ or HLG nit scale** to read absolute brightness. Diffuse white should sit near 203 nits, highlights ride above that, and only a small percentage of pixels should reach the 600–1 000 nit "sparkle" zone.

## Layout & Spacing

| Setting                 | Description                                                         |
| ----------------------- | ------------------------------------------------------------------- |
| **Channel spacing**     | Gap between parade channels (0–30 px). Only active in parade modes. |
| **Top & Bottom margin** | Vertical margin (0–100 px)                                          |
| **Left margin**         | Space for the scale labels                                          |
| **16:9 ratio**          | Lock the scope aspect ratio to 16:9                                 |

## Color Pins

When color pins are placed on the [Source Signal](/nobe-omniscope/scopes/source-signal) viewer, they are reflected on the waveform:

* **Luma / RGB modes** — circle at the pin's horizontal position and luma value
* **Parade modes** — circles in each channel lane at the respective R, G, B values
* Hovering a pin draws a horizontal line at its luma level

## Keyboard Shortcuts

| macOS                   | Windows                 | Action                                  |
| ----------------------- | ----------------------- | --------------------------------------- |
| Mouse wheel             | Mouse wheel             | Zoom in/out                             |
| Space + Left-click drag | Space + Left-click drag | Pan zoomed waveform                     |
| Middle-click            | Middle-click            | Reset zoom                              |
| Alt (hold)              | Alt (hold)              | Morph between waveform and source image |

## StreamDeck / Action Editor

| Action                       | Description                                                                             |
| ---------------------------- | --------------------------------------------------------------------------------------- |
| **WaveformZoomBlacks**       | Cycle zoom presets for shadows (5×/7.5×/10×/1×). Also supports continuous dial control. |
| **WaveformZoomWhites**       | Cycle zoom presets for highlights                                                       |
| **WaveformTogglePeakLevels** | Toggle peak level indicators                                                            |

## Related

* [Global Targets](/nobe-omniscope/features/global-targets)
* [3D LUT & Color Management](/nobe-omniscope/features/3d-lut)
* [Gamut Check](/nobe-omniscope/qc/gamut-check)
* [Available Actions](/nobe-omniscope/streamdeck/available-actions)


# Vectorscope

The Vectorscope plots **chrominance** on a circular graph — hue as angle from 0°, saturation as distance from the center (which represents gray). Use it to evaluate color balance, skin-tone accuracy, and broadcast-legal saturation.

The classic vectorscope is a plot of the **Cb / Cr** plane of Y'CbCr — the two color-difference signals that, together with luma (Y'), fully describe a video picture. "Zero chroma" is the center point, which is why neutral gray, white, and black of every level all collapse to a single dot there.

<figure><img src="https://565437294-files.gitbook.io/~/files/v0/b/gitbook-x-prod.appspot.com/o/spaces%2F-MFqn5MuayPgQPMZ9pwf%2Fuploads%2Fgit-blob-0b8796bfcb56245063c30f77209ff5e89f95f112%2F2026-02_vectorscope.jpg?alt=media" alt=""><figcaption><p>Vectorscope with 75 % targets, skin-tone line, and I/Q guides</p></figcaption></figure>

<figure><img src="https://565437294-files.gitbook.io/~/files/v0/b/gitbook-x-prod.appspot.com/o/spaces%2F-MFqn5MuayPgQPMZ9pwf%2Fuploads%2Fgit-blob-75dbf8942ff4041e55e3eff43fe209fd21447cb4%2F2026-03_vectorscope-features.gif?alt=media" alt=""><figcaption><p>Vectorscope features: Color Wheel mode, hexagonal rings, trace outline, skin-tone tolerance band, improved target indicators, and I/Q lines</p></figcaption></figure>

## Transform Modes

| Mode    | Description                                               |
| ------- | --------------------------------------------------------- |
| **YUV** | Classic broadcast vectorscope (CbCr plane). Default.      |
| **HSL** | Saturation-weighted projection — useful for look-dev work |

You can switch **Orientation** to the alternate rotation mode in either transform mode. For a color-wheel-style orientation, use **HSL** transform with the alternate orientation mode.

## Zoom

Zoom into the center of the plot for fine color-balance work or expand to see the full gamut.

| Input                                | Action                     |
| ------------------------------------ | -------------------------- |
| **Mouse wheel**                      | Zoom in / out (continuous) |
| **Middle-click** or **Double-click** | Reset to 100 %             |

<figure><img src="https://565437294-files.gitbook.io/~/files/v0/b/gitbook-x-prod.appspot.com/o/spaces%2F-MFqn5MuayPgQPMZ9pwf%2Fuploads%2Fgit-blob-383388024561cb3cead99eb111d90da808ae9667%2F2026-02_vectorscope-zoom.jpg?alt=media" alt=""><figcaption><p>Zoomed vectorscope for precise color balance inspection</p></figcaption></figure>

Context-menu presets: **100 %** and **200 %** for quick switching.

### Input Gain

Boost the trace intensity to reveal low-saturation detail.

| Input                                               | Action              |
| --------------------------------------------------- | ------------------- |
| **Mouse wheel** (with **Mouse wheel gain** enabled) | Adjust gain (1×–5×) |
| **Middle-click** or **Double-click**                | Reset gain to 1×    |

Enable **Mouse wheel gain** in the scope settings to switch the scroll wheel from zoom to gain control.

## Graticule & Guides

<figure><img src="https://565437294-files.gitbook.io/~/files/v0/b/gitbook-x-prod.appspot.com/o/spaces%2F-MFqn5MuayPgQPMZ9pwf%2Fuploads%2Fgit-blob-7ba116eceb8c90b56f1d3522bc940210743be725%2F2026-02_vectorscope-graticule-settings.jpg?alt=media" alt=""><figcaption><p>Graticule and guide settings</p></figcaption></figure>

### Graticule Style

| Style           | Description                                                |
| --------------- | ---------------------------------------------------------- |
| **Standard**    | Circular rings with crosshair, I/Q lines, and target boxes |
| **Hue Vectors** | Gradient-based hue visualization with directional vectors  |
| **Color Wheel** | Full color wheel background for intuitive hue reference    |

<figure><img src="https://565437294-files.gitbook.io/~/files/v0/b/gitbook-x-prod.appspot.com/o/spaces%2F-MFqn5MuayPgQPMZ9pwf%2Fuploads%2Fgit-blob-2b4611e7d1a834cfb85adb585bb0a182dd3dc8b2%2F2026-02_vectorscope-hue-vectors.jpg?alt=media" alt=""><figcaption><p>Hue Vectors graticule style</p></figcaption></figure>

<figure><img src="https://565437294-files.gitbook.io/~/files/v0/b/gitbook-x-prod.appspot.com/o/spaces%2F-MFqn5MuayPgQPMZ9pwf%2Fuploads%2Fgit-blob-d23e05930a19e4d7d992c8f8c661b18a46d6f6f9%2F2026-02_vectorscope-colorwheel-mode.jpg?alt=media" alt=""><figcaption><p>Color Wheel graticule style</p></figcaption></figure>

### Guide Elements

| Guide              | Description                                                                      |
| ------------------ | -------------------------------------------------------------------------------- |
| **HUE Ring**       | Color wheel around the outer edge. Can be **dimmed** for less distraction.       |
| **Crosshair**      | X/Y axis lines through center                                                    |
| **Rings**          | Saturation reference rings. Toggle between **circular** and **hexagonal** paths. |
| **I/Q Lines**      | In-phase / Quadrature axis guides                                                |
| **Outer Scale**    | Tick marks around the outer ring                                                 |
| **Vectors**        | Broadcast color-bar target markers                                               |
| **Skin-tone Line** | Configurable reference line at a user-defined hue angle (default 123°)           |

### Skin-Tone Indicator Band

The skin-tone line can be expanded into an optional tolerance band. This helps you quickly see whether skin hues stay close to your chosen reference angle.

| Setting                  | Description                                                              |
| ------------------------ | ------------------------------------------------------------------------ |
| **Show Fleshtone Line**  | Enables the skin-tone reference axis                                     |
| **Fleshtone Angle**      | Sets the reference angle (0–359°, default 123°)                          |
| **Show Tolerance Band**  | Draws a shaded angular band around the reference line                    |
| **Tolerance**            | Band half-width in degrees (±1° to ±45°; common values are ±10° or ±20°) |
| **Tolerance Band Color** | Adjust band color and opacity for visibility                             |

<figure><img src="https://565437294-files.gitbook.io/~/files/v0/b/gitbook-x-prod.appspot.com/o/spaces%2F-MFqn5MuayPgQPMZ9pwf%2Fuploads%2Fgit-blob-7d11de383231b068d75e60ee38b9e66a709daed7%2F2026-02_vectorscope-skintone-band.jpg?alt=media" alt=""><figcaption><p>Skin-tone tolerance band on the vectorscope</p></figcaption></figure>

Interpretation: trace energy inside the band is within your current skin-tone tolerance; trace energy outside the band indicates hue drift from that reference.

### Broadcast Targets

| Target    | Description                                   |
| --------- | --------------------------------------------- |
| **75 %**  | Standard 75 % color-bar targets (default: on) |
| **100 %** | Full-level color-bar targets                  |

Target color and position are derived from the active color space.

## Trace Presentation

| Setting                          | Description                                                                                                                                                                                                                                                                                                                                                                                                                                         |
| -------------------------------- | --------------------------------------------------------------------------------------------------------------------------------------------------------------------------------------------------------------------------------------------------------------------------------------------------------------------------------------------------------------------------------------------------------------------------------------------------- |
| **Colorize**                     | Tint the trace with per-pixel color (vs. monochrome)                                                                                                                                                                                                                                                                                                                                                                                                |
| **Linearize trace** ("De-gamma") | Apply the inverse EOTF to the trace-density accumulator so that the visual brightness of the plot follows light-linear energy instead of the non-linear R'G'B' code values. Makes shadow-region and highlight-region saturation appear with similar visual weight — useful for log or HDR signals where a raw trace would be dominated by midtone density. It does **not** change the chroma position of any sample, only how brightly it is drawn. |
| **Smooth Trace**                 | Temporal blend for a cleaner, less noisy look                                                                                                                                                                                                                                                                                                                                                                                                       |
| **Enhanced Render**              | Line-strip rendering instead of point cloud                                                                                                                                                                                                                                                                                                                                                                                                         |
| **Gain**                         | Master trace brightness (0.02–3.0)                                                                                                                                                                                                                                                                                                                                                                                                                  |
| **Enhance Center**               | Extra gain applied to the low-saturation core (0–12)                                                                                                                                                                                                                                                                                                                                                                                                |

### Highlight Trace Edges

Render a colored outline at the outermost boundary of the trace — highlights the signal extent at a glance.

<figure><img src="https://565437294-files.gitbook.io/~/files/v0/b/gitbook-x-prod.appspot.com/o/spaces%2F-MFqn5MuayPgQPMZ9pwf%2Fuploads%2Fgit-blob-a3eb464760e6a4bb7f7f9737972d03a21658731a%2F2026-02_vectorscope-trace-highlight.jpg?alt=media" alt=""><figcaption><p>Trace edge highlight showing signal boundary</p></figcaption></figure>

## Split Tones (L/M/H)

Split the trace into three independent **Lows / Mids / Highs** buckets, each drawn in its own circle. Buckets are defined by **luma** (Y', the weighted R'G'B' sum — not scene-linear luminance), so the split follows the same tonal perception a colorist uses when talking about lift / gamma / gain. This reveals how color shifts across shadow, midtone, and highlight regions.

<figure><img src="https://565437294-files.gitbook.io/~/files/v0/b/gitbook-x-prod.appspot.com/o/spaces%2F-MFqn5MuayPgQPMZ9pwf%2Fuploads%2Fgit-blob-bcdcb5b782a198537f9c5c0f25ceb0649b2a8f2c%2F2026-02_vectorscope-hml.jpg?alt=media" alt=""><figcaption><p>Vectorscope in L/M/H split mode</p></figcaption></figure>

<figure><img src="https://565437294-files.gitbook.io/~/files/v0/b/gitbook-x-prod.appspot.com/o/spaces%2F-MFqn5MuayPgQPMZ9pwf%2Fuploads%2Fgit-blob-e65f5e8babff42dba28e2abe0500166b89d8e9fc%2F2026-02_vectorscope-colorwheel-hml.jpg?alt=media" alt=""><figcaption><p>L/M/H split with Color Wheel graticule</p></figcaption></figure>

| Setting             | Description                                    |
| ------------------- | ---------------------------------------------- |
| **Split L/M/H**     | Enable the three-way split                     |
| **LM ratio**        | Boundary between Lows and Mids (default 33 %)  |
| **MH ratio**        | Boundary between Mids and Highs (default 66 %) |
| **Ring brightness** | Adjust graticule brightness per bucket         |
| **Enhanced render** | Sharper rendering for split view               |

### L/M/H Preview

Hold **Alt** to see a false-color overlay on the Source Signal showing which pixels fall into each luma range — blue for lows, green for mids, red for highs.

<figure><img src="https://565437294-files.gitbook.io/~/files/v0/b/gitbook-x-prod.appspot.com/o/spaces%2F-MFqn5MuayPgQPMZ9pwf%2Fuploads%2Fgit-blob-fb6f2a4570a2f9f56bcae5f95b76121c7d12ed85%2F2026-02_vectorscope-hml-preview.jpg?alt=media" alt=""><figcaption><p>L/M/H preview overlay showing luminance ranges on the source image</p></figcaption></figure>

### Zoomed L/M/H

Use the standard vectorscope zoom controls while inspecting the split circles.

<figure><img src="https://565437294-files.gitbook.io/~/files/v0/b/gitbook-x-prod.appspot.com/o/spaces%2F-MFqn5MuayPgQPMZ9pwf%2Fuploads%2Fgit-blob-f74834129577197a5624d5ae15e90c2ca0d51cde%2F2026-02_vectorscope-hml-zoom.jpg?alt=media" alt=""><figcaption><p>Zoomed L/M/H split — focus on mids</p></figcaption></figure>

### Luma Range Clamp

Instead of splitting into three buckets, clamp to a **single luma range** using the **Min / Max** sliders. Only pixels whose Y' falls within the range are plotted — useful for isolating the color of skin pixels, of highlights alone, or of a specific zone of the image without masking.

## Saturation Alerts

Set thresholds to flag illegal or excessive saturation levels.

<figure><img src="https://565437294-files.gitbook.io/~/files/v0/b/gitbook-x-prod.appspot.com/o/spaces%2F-MFqn5MuayPgQPMZ9pwf%2Fuploads%2Fgit-blob-5dd2527819869b1a2a640c86ad692db8d82cef0d%2F2026-02_vectorscope-saturation-alert.jpg?alt=media" alt=""><figcaption><p>Saturation alert ring and max ring indicators</p></figcaption></figure>

| Alert          | Description                                                                                                                                    |
| -------------- | ---------------------------------------------------------------------------------------------------------------------------------------------- |
| **Alert Ring** | Colored ring at a configurable saturation threshold. Signal exceeding it triggers a visual warning. Drag the ring interactively to reposition. |
| **Max Ring**   | Tracks and displays the absolute maximum saturation contour in real time                                                                       |
| **Outline**    | GPU-rendered trace boundary with anti-aliasing. Use the **Outline Thickness** slider to adjust the rendered width (0.5–5 px).                  |

Each alert has a customizable **color**.

## Low-Pass Filter

Enable **Low-Pass filter** to apply a horizontal box blur to the trace, reducing noise and making trends easier to read. Adjustable kernel size (0.5–20).

## Global Targets

[Global targets](/nobe-omniscope/features/global-targets) appear as RGB reference points on the vectorscope, providing shared color targets across all scopes and layouts.

## Color Pins

When color pins are placed on the [Source Signal](/nobe-omniscope/scopes/source-signal), they appear as markers on the vectorscope at the corresponding hue/saturation position.

<figure><img src="https://565437294-files.gitbook.io/~/files/v0/b/gitbook-x-prod.appspot.com/o/spaces%2F-MFqn5MuayPgQPMZ9pwf%2Fuploads%2Fgit-blob-e0f32840a82ab20cd781c843ba7961088411c0ef%2F2026-02_vectorscope-color-pins.jpg?alt=media" alt=""><figcaption><p>Color pins reflected on the vectorscope</p></figcaption></figure>

Right-click any color pin on the vectorscope to **Set as custom target** — a quick way to turn a sampled color into a [global target](/nobe-omniscope/features/global-targets) without manually entering values.

<figure><img src="https://565437294-files.gitbook.io/~/files/v0/b/gitbook-x-prod.appspot.com/o/spaces%2F-MFqn5MuayPgQPMZ9pwf%2Fuploads%2Fgit-blob-2ac96b8cf426f5c2f30216326fd4331eea02bf76%2F2026-03_color-pin-to-target.jpg?alt=media" alt=""><figcaption><p>Right-click a color pin to set it as a custom target</p></figcaption></figure>

## Color Space

The vectorscope defaults to the working signal. Use **Color Space Transform override** in Source & Input to evaluate the trace in a selected working/display transform.

## Skin-Tone Practice

Skin tones usually align close to the **skin-tone axis**, a reference direction inherited from the NTSC I/Q color-difference system. I and Q were axes rotated 33° from Cb/Cr to align the high-bandwidth **I (In-phase)** axis with the orange/cyan "memory color" line that human vision is most sensitive to — and the **-I** direction corresponds roughly to human skin. Most properly exposed skin falls within \~10–20° of that axis regardless of complexion; only hue balance differs, not the underlying axis.

Creative and regional preferences still apply, so use the tolerance band as a visual guide, not a hard rule. A heavily stylized grade will deliberately pull skin off-axis.

## Keyboard Shortcuts

| macOS        | Windows      | Action                          |
| ------------ | ------------ | ------------------------------- |
| Mouse wheel  | Mouse wheel  | Zoom (or Input Gain if enabled) |
| Middle-click | Middle-click | Reset zoom / gain               |
| Alt (hold)   | Alt (hold)   | Preview L/M/H split ranges      |

## StreamDeck / Action Editor

| Action              | Description                                                 |
| ------------------- | ----------------------------------------------------------- |
| **VectorScopeZoom** | Button: toggle 1×/2× zoom. Dial: fine zoom (±5 %, 35–500 %) |
| **VectorToggleLmh** | Toggle Split L/M/H mode                                     |

## Related

* [Global Targets](/nobe-omniscope/features/global-targets)
* [Gamut Check](/nobe-omniscope/qc/gamut-check)
* [Skintone Scope](/nobe-omniscope/scopes/skintone-scope)
* [Available Actions](/nobe-omniscope/streamdeck/available-actions)


# Sat / Lum

Saturation over luma scope

The Sat/Lum scope plots each pixel in a 2D space where the **X axis** is **luma (Y')** — the weighted-sum of the non-linear R'G'B' channels used in Y'CbCr — and the **Y axis** is **saturation**, computed as the length of the CbCr (or UV) chroma vector from the neutral axis. A fully desaturated pixel (gray, white, black) sits on the bottom edge regardless of its luma; a fully saturated primary sits at the top. This makes the scope a compact at-a-glance view of how saturated the picture is across the tonal range.

![](https://565437294-files.gitbook.io/~/files/v0/b/gitbook-legacy-files/o/assets%2F-MFqn5MuayPgQPMZ9pwf%2F-MHFbxW8xAyHrCaBF3BJ%2F-MHGq-3bbHE1WiPorU2H%2FScreenshot%202020-09-15%20at%2014.56.54.jpg?alt=media\&token=dd489de9-f480-4d57-bf2c-3dab8e15fc31)

## Reading the plot

* **Shadows on the left**, **highlights on the right**
* **Low saturation at the bottom**, **high saturation at the top**
* A tight, narrow trace at low saturation → the image is nearly neutral
* A trace that bulges toward the top-right → saturated highlights (common cause of clipping perceived as "burned" color)
* A trace that bulges toward the top-left → saturated shadows (often indicates chroma noise or crushed blacks with a color cast)

Because naturally exposed footage has most pixels in the midtone range, the trace usually hugs the center. Outliers are what you're looking for.

## Color Space Selection

The CbCr coefficients used to compute the chroma vector depend on the active color space — **Ccir 601** for SD, **Rec. 709** for HD, **Rec. 2020** for UHD. This affects both where pixels land horizontally (luma coefficients differ) and how far they extend vertically (chroma scaling differs).

| Color space   | Usage                                              |
| ------------- | -------------------------------------------------- |
| **Ccir 601**  | Legacy SD broadcast (Kb = 0.114, Kr = 0.299)       |
| **Rec. 709**  | HD broadcast / most SDR (Kb = 0.0722, Kr = 0.2126) |
| **Rec. 2020** | UHD / HDR container (Kb = 0.0593, Kr = 0.2627)     |

## Options

* **Colorize** — tint each trace sample with the pixel's own color
* **Color space selection** — Ccir 601 / Rec. 709 / Rec. 2020

## Related

* [Vectorscope](/nobe-omniscope/scopes/vectorscope) — raw CbCr plane without the luma axis
* [Histogram](/nobe-omniscope/scopes/histogram) — saturation mode


# CIE Plot

The CIE Plot visualizes the **chromaticity** of the signal on the CIE chromaticity diagram — the horseshoe-shaped footprint of all colors visible to an average human observer. Each triangle drawn on top of it is the gamut of a **color space**, defined by its three primaries and a white point. Pixels from your image are plotted as dots inside the horseshoe so you can see, at a glance, how much of the target gamut the image actually uses and whether any pixels spill outside it.

The CIE diagram is built from the **CIE 1931 Standard Observer** — color-matching functions derived from Wright and Guild's 1928–29 experiments (17 subjects matching reference lights through a small foveal field of view). The outer horseshoe boundary is the **spectral locus**: the position of every pure monochromatic wavelength from \~380 nm (violet) to \~700 nm (red). The straight bottom edge is the **line of purples**, which closes the locus between violet and red — purples don't exist as single wavelengths, they're always mixtures.

## Supported Gamuts

CIE Plot overlays the following gamut triangles:

| Gamut         | Primaries / Container                                                                                |
| ------------- | ---------------------------------------------------------------------------------------------------- |
| **Rec. 709**  | HD broadcast / consumer sRGB (same primaries)                                                        |
| **Rec. 2020** | UHD container, wider than any current mastering display                                              |
| **P3**        | DCI-P3 theatrical and P3-D65 consumer HDR                                                            |
| **ACES AP0**  | Largest gamut in production use — encloses all visible colors (primaries outside the spectral locus) |
| **ACES AP1**  | ACEScg working space — tighter than AP0, still wider than Rec. 2020                                  |
| **ProPhoto**  | ROMM RGB — wide, print-oriented still-photography gamut                                              |
| **Adobe RGB** | \~Rec. 709 + a wider cyan/green region, common in photo pipelines                                    |

When OmniScope cannot resolve a live OCIO working space, CIE Plot falls back to the source metadata instead: **Rec. 2020** for Rec. 2020-tagged frames, otherwise **Rec. 709**. This keeps the plot usable even when OCIO is unavailable.

## White Points

Gamut triangles are anchored to a white point — the chromaticity the display renders when `R = G = B`:

| White point | Chromaticity (x, y) | Used by                                          |
| ----------- | ------------------- | ------------------------------------------------ |
| **D65**     | 0.3127, 0.3290      | Rec. 709, Rec. 2020, sRGB, P3-D65 (consumer HDR) |
| **D60**     | 0.32168, 0.33767    | ACES default, some reference projection          |
| **DCI**     | 0.3140, 0.3510      | DCI-P3 theatrical ("P3-DCI") — greener than D65  |

D65 is a CIE Daylight illuminant approximating average noon daylight at \~6504 K. D60 and DCI sit close on the Planckian locus but at different correlated color temperatures.

![CIE Plot](https://565437294-files.gitbook.io/~/files/v0/b/gitbook-legacy-files/o/assets%2F-MFqn5MuayPgQPMZ9pwf%2F-MG0YqGMVo5HPwTZO7sW%2F-MG0ZDZko4LfEDzL7GGM%2FScreenshot%202020-08-31%20at%2000.50.36.jpg?alt=media\&token=2e3dce0b-cd0b-4458-aa75-e3f9286ba26f)

## Blackbody (Planckian) Curve

Enable **Blackbody temp curve** to overlay the **Planckian locus** — the chromaticity trajectory of an ideal blackbody radiator as its temperature changes. This is the curve that correlated color temperature (CCT) references; a "5500 K daylight" light lies on or near this locus. Useful for verifying white-balance decisions and for seeing how far your image's average chromaticity drifts from a neutral daylight reference.

## Gamut Error Check

In HDR workflows, when monitoring a Rec. 2020 signal, you can flag pixels that fall **outside P3** by enabling **Gamut Error Check**. P3 is the realistic chromaticity target for today's mastering and consumer HDR displays, even when the signal is carried inside the wider Rec. 2020 container.

<figure><img src="https://565437294-files.gitbook.io/~/files/v0/b/gitbook-x-prod.appspot.com/o/spaces%2F-MFqn5MuayPgQPMZ9pwf%2Fuploads%2FIptM8FbonfcK6YjVxMQ7%2FCleanShot%202023-10-06%20at%2013.31.01%402x.png?alt=media&amp;token=edeb54a1-c3b6-4355-8b85-aeb01dd0aea3" alt=""><figcaption></figcaption></figure>

Out-of-gamut pixels are rendered with an inverted color (yellow pixels above the P3 triangle instead of blue) so they visually separate from in-gamut energy.

## Custom Primaries

Custom primaries can be defined in the scope settings for non-standard gamuts (camera native spaces, vendor-specific working spaces, etc.):

![](https://565437294-files.gitbook.io/~/files/v0/b/gitbook-legacy-files/o/assets%2F-MFqn5MuayPgQPMZ9pwf%2F-MG0b01OC7sL_bbLEpFv%2F-MG0bpCiMq1CMV4w37Bl%2FScreenshot%202020-08-31%20at%2001.05.57.jpg?alt=media\&token=67f89006-86ae-402f-b356-4ef75e36de8b)

## Coordinate Systems

**CIE 1931 xy** is the historical default — the diagram most colorists recognize. Its horseshoe is not perceptually uniform: small distances in the green region correspond to *much* larger perceived color differences than equivalent distances in the red or blue regions. This is the famous "MacAdam ellipses" problem — ellipses of just-noticeable-difference are tiny in blue/purple and huge in green.

**CIE 1976 u'v'** (`u' = 4X/(X+15Y+3Z)`, `v' = 9Y/(X+15Y+3Z)`) is available in 1.11.25+ and is **more perceptually uniform** — the just-noticeable-difference ellipses become closer to uniform circles across the diagram. This makes visual comparisons of gamut coverage more honest. u'v' is also the coordinate system underlying modern color-difference metrics like **ΔE** in CIE Lab/Luv.

Switch to u'v' when you want an honest visual sense of how much "extra color volume" a wider gamut actually gives you; stay on 1931 xy when you need to match the diagrams in classic textbooks and specifications.

<figure><img src="https://565437294-files.gitbook.io/~/files/v0/b/gitbook-x-prod.appspot.com/o/spaces%2F-MFqn5MuayPgQPMZ9pwf%2Fuploads%2Fgit-blob-ff30eaed35198542277cfaec5db46cffdf158f19%2F2026-03_cie-plot-1976-uv.jpg?alt=media" alt=""><figcaption><p>CIE 1976 u'v' coordinate system with Rec. 709 gamut</p></figcaption></figure>

## What's plotted, and what's discarded

The chromaticity plot **discards luminance**. A dim red pixel and a bright red pixel of the same chromaticity land on the same spot. Brightness is handled by the waveform and HDR Limit tools; the CIE Plot is purely about **which colors** are present, not how bright they are. That's why the CIE Plot is so valuable alongside a waveform — together they describe both the **position in chromaticity** and the **position in light** of every pixel.

## Directional Indicators (1.11.22+)

Directional indicators can be enabled to show drift direction relative to the target gamut — useful when gamut-mapping decisions need to know whether out-of-gamut energy is pushing toward greens, reds, or elsewhere.

## Related

* [Gamut Scope](/nobe-omniscope/scopes/gamut-scope) — false-color gamut-error overlay on the source image
* [Gamut Check](/nobe-omniscope/qc/gamut-check) — QC rule variant


# Gamut Scope

Gamut Scope flags pixels that lie **outside a target color gamut** — the set of chromaticities a display can actually reproduce. A common use case is checking whether a Rec. 2020 / PQ (SMPTE ST 2084) HDR master stays inside the **P3-D65** gamut that real mastering and consumer HDR displays can show.

Gamut and transfer function are separate properties of a signal. "Rec. 2020" describes the **container primaries and white point** (chromaticity), while "PQ" / "HLG" describe the **EOTF** (how code values map to light). Gamut Scope checks the chromaticity side of that pair — the transfer function is handled by the waveform and HDR Limit QC.

It works in False Color mode — pixels within range are rendered in grayscale, pixels near the gamut edge are colored orange, and out-of-gamut pixels are rendered in red:

<figure><img src="https://565437294-files.gitbook.io/~/files/v0/b/gitbook-x-prod.appspot.com/o/spaces%2F-MFqn5MuayPgQPMZ9pwf%2Fuploads%2Frqynej4UOal3JJsgAJNs%2FCleanShot%202023-10-06%20at%2013.34.53%402x.png?alt=media&amp;token=70d091c4-c0bd-4b6c-965d-cce857e8b96b" alt=""><figcaption></figcaption></figure>

You can also use Gamut Scope to monitor absolute luminance (nits) and set a maximum-brightness threshold:

<figure><img src="https://565437294-files.gitbook.io/~/files/v0/b/gitbook-x-prod.appspot.com/o/spaces%2F-MFqn5MuayPgQPMZ9pwf%2Fuploads%2FE09HelRn0js4U7aKeWmW%2FCleanShot%202023-10-06%20at%2013.38.57%402x.png?alt=media&amp;token=00616696-e7ea-4af6-b4e7-6b173c6031e9" alt=""><figcaption><p>Setting the threshold to 500 nits</p></figcaption></figure>

In the scope you can see which part of the image exceeded the given brightness:

<figure><img src="https://565437294-files.gitbook.io/~/files/v0/b/gitbook-x-prod.appspot.com/o/spaces%2F-MFqn5MuayPgQPMZ9pwf%2Fuploads%2FH8ZN4AOKiB4Q4DOGKLCa%2FCleanShot%202023-10-06%20at%2013.38.40%402x.png?alt=media&amp;token=8d62ecdd-cbd1-455b-900f-67659f362db5" alt=""><figcaption></figcaption></figure>

## Why gamut mapping matters in HDR

A Rec. 2020 master can carry chromaticities no current mastering monitor can display. Most high-end HDR monitors cover \~95–99 % of **DCI-P3**, not Rec. 2020 — the extra Rec. 2020 volume exists as a *container* for the future. When such a signal reaches a P3-limited display the downstream tone/gamut mapper has to decide how to handle out-of-P3 pixels, and different players will make different choices. Finding those pixels in the grading suite lets the colorist make the call instead of the TV.

This is why mastering pipelines often grade to **P3-D65 ST 2084** limited inside a Rec. 2020 container — ensuring the image as graded will render predictably on today's hardware while still being future-proof.

## Directional Indicators (1.11.22+)

Directional arrows show which way colors would have to move — in chromaticity space — to return to the target gamut.

## Gamut Error Display (1.10.134+)

Gamut errors are highlighted for both SDR (Rec. 709 inside a wider working space) and HDR (P3 inside Rec. 2020) signals.

## Related

* [CIE Plot](/nobe-omniscope/scopes/cie-plot) — visualize the signal's actual chromaticity locus against the target gamut triangle
* [HDR Limit](/nobe-omniscope/qc/hdr-limit) — nit-level QC for HDR deliverables
* [Gamut Check](/nobe-omniscope/qc/gamut-check) — pass/fail QC rule variant


# Min Max

The Min/Max scope plots the minimum and maximum luma (Y') — or decoded nit value in a PQ/HLG scale — for each horizontal scan line, giving a compact overview of the signal's dynamic range across the frame. It is especially useful for HDR workflows when monitoring the "brightness envelope" of the image and verifying that levels stay within legal bounds.

Where a standard waveform shows *every* sample on each column, Min/Max shows only the two extremes per line. The trace is sparser, the envelope is easier to read at a glance, and clipping excursions jump out immediately.

<figure><img src="https://565437294-files.gitbook.io/~/files/v0/b/gitbook-x-prod.appspot.com/o/spaces%2F-MFqn5MuayPgQPMZ9pwf%2Fuploads%2FcOqxIysY2ZzBU9rEe3GD%2FCleanShot%202023-10-06%20at%2013.41.36%402x.png?alt=media&amp;token=7e1d5299-f572-4307-9a5b-d4f846b730cd" alt=""><figcaption><p>Min/Max scope with peak level indicators</p></figcaption></figure>

{% hint style="info" %}
Min/Max scope requires a **Pro** license.
{% endhint %}

## How It Works

Two traces are drawn for every scan line of the image:

* **Max trace** — the brightest pixel on that line (highest luma or nit value)
* **Min trace** — the darkest pixel on that line (lowest luma or nit value)

The gap between the two traces represents the local contrast range per line. A narrow gap means low contrast on that line; a wide gap means high contrast. In well-graded HDR content, the **max trace** rides the highlights — you want to see it occasionally reach into the 600–1 000 nit "sparkle" zone but stay mostly below — and the **min trace** hugs shadows without slamming against the bottom.

## Scale

| Scale          | Range         |
| -------------- | ------------- |
| **IRE**        | 0–100         |
| **8-bit**      | 0–255         |
| **10-bit**     | 0–1023        |
| **PQ ST 2084** | 0–10 000 nits |
| **HLG**        | 0–1 000 nits  |

The scale follows the input source by default. Enable **Scale override** to choose a specific scale.

**Legal range lines** are drawn at legal black and legal white (e.g. 64 and 940 in 10-bit) when enabled.

## Error Thresholds

Set **minimum** and **maximum** allowed levels (in the active scale). When the signal exceeds these bounds, the affected region is highlighted in red — useful for flagging illegal blacks or clipped highlights during QC.

## Peak Levels

Enable **Show Peak Levels** to display numeric min/max readouts with horizontal marker lines. The values update in real time and adapt to the current scale (integer for SDR, nits with decimal precision for HDR).

Peak level color is configurable.

## Custom Targets

Up to 4 independent reference lines at specific levels (0–1023 in 10-bit scale, or a nit value in PQ/HLG scale). Each target has:

* **Enable/disable** toggle
* **Value** slider with visual gradient indicator
* **Color** picker

Useful for marking black points, white points, mid-gray, or HDR reference levels.

## Display Options

| Setting                 | Description                                                                                                    |
| ----------------------- | -------------------------------------------------------------------------------------------------------------- |
| **Dim source image**    | Darken the background image (0–100 %) to make the overlay stand out. Adjustable with **mouse wheel** on hover. |
| **Colorize**            | Color-code the trace — green for within bounds, red for errors                                                 |
| **Enhance Edges**       | Increase trace contrast for better visibility (0–12)                                                           |
| **Top & Bottom margin** | Vertical margin for scale labels                                                                               |
| **Left & Right margin** | Horizontal margin for scale labels                                                                             |

## Keyboard Shortcuts

| Input                      | Action                 |
| -------------------------- | ---------------------- |
| **Mouse wheel** (on scope) | Adjust dim strength    |
| **Alt** (hold)             | Show crosshair overlay |

## Related

* [Waveform](/nobe-omniscope/scopes/waveform)
* [Histogram](/nobe-omniscope/scopes/histogram)
* [Global Targets](/nobe-omniscope/features/global-targets)
* [Gamut Check](/nobe-omniscope/qc/gamut-check)


# Histogram

The Histogram scope shows value distribution across the selected signal domain. Use it for exposure distribution, channel clipping checks, and mask-range selection.

## Modes

| Mode           | Description                                                                                                                                                                                                                                  |
| -------------- | -------------------------------------------------------------------------------------------------------------------------------------------------------------------------------------------------------------------------------------------- |
| **RGB**        | Combined R'G'B' code-value histogram — counts across all three channels overlaid                                                                                                                                                             |
| **Split RGB**  | Separate R/G/B histograms (available only in **RGB + Horizontal** layout)                                                                                                                                                                    |
| **Luma**       | Luma (Y') distribution — weighted sum of the non-linear R'G'B' channels using the active color space's luma coefficients (Rec. 709: 0.2126 / 0.7152 / 0.0722; Rec. 2020: 0.2627 / 0.6780 / 0.0593). Not to be confused with scene luminance. |
| **Hue**        | Hue distribution across 0–360°                                                                                                                                                                                                               |
| **Saturation** | Saturation distribution (0–100%)                                                                                                                                                                                                             |

## Layout & Zoom

| Setting                              | Description                           |
| ------------------------------------ | ------------------------------------- |
| **Horizontal / Vertical**            | Histogram orientation                 |
| **Left to right**                    | Direction control for vertical layout |
| **Mouse wheel**                      | Adjust histogram gain (25%–2000%)     |
| **Middle-click** or **Double-click** | Reset gain to 100%                    |

## Frequency Scale

The frequency scale changes how pixel-count differences are displayed without changing the signal-level axis:

| Mode            | Description                                                                                    |
| --------------- | ---------------------------------------------------------------------------------------------- |
| **Fit**         | Fits the complete histogram curve in the plot                                                  |
| **Auto detail** | Reveals smaller populations while marking off-scale spikes with triangles at the plot boundary |
| **Log**         | Compresses large differences in pixel counts so low-frequency detail remains visible           |

Enable **Hold scale** to keep the current frequency reference while comparing shots. Changing the source or histogram mode resets the held reference. Use **Gain** to magnify the resulting curve manually.

## Scale & HDR Guides

Histogram scale follows the active project/input scale (IRE, %, 8-bit, 10-bit, PQ, HLG). Non-linear scales like PQ and HLG are **absolute** — their bins correspond to decoded nit values via the inverse EOTF, so a peak in the 1 000 nit bin means *1 000 nits*, regardless of the display the scope is running on.

When HDR scale mode is set to **HDR Reference**, PQ/HLG guides include key labels such as:

* **26 nits** — SDR-equivalent midtone reference
* **203 nits** — SMPTE ST 2084-A reference diffuse white
* **1 000 nits** — most common HDR mastering-display peak

Legal-range guides (narrow-range / video-range code values from Rec. 709 and Rec. 2020) are shown where applicable:

* **8-bit video legal**: 16 / 235
* **10-bit video legal**: 64 / 940

![RGB Histogram](https://565437294-files.gitbook.io/~/files/v0/b/gitbook-legacy-files/o/assets%2F-MFqn5MuayPgQPMZ9pwf%2F-MG0ZF6QsbE5exszd6wP%2F-MG0ZoD7UW6vtlttuPhW%2FScreenshot%202020-08-31%20at%2000.51.37.jpg?alt=media\&token=d22c3908-8529-423c-bf05-4af92daa94ac)

![Split RGB Histogram](https://565437294-files.gitbook.io/~/files/v0/b/gitbook-legacy-files/o/assets%2F-MFqn5MuayPgQPMZ9pwf%2F-MG0ZF6QsbE5exszd6wP%2F-MG0_59b5F8wXUDFAFmf%2FScreenshot%202020-08-31%20at%2000.52.28.jpg?alt=media\&token=3be64ade-d25c-41ab-86c2-729006093b61)

![Luma Histogram](https://565437294-files.gitbook.io/~/files/v0/b/gitbook-legacy-files/o/assets%2F-MFqn5MuayPgQPMZ9pwf%2F-MG0ZF6QsbE5exszd6wP%2F-MG0ZsXUuc-1UzbcmG83%2FScreenshot%202020-08-31%20at%2000.51.41.jpg?alt=media\&token=5dd57709-b626-48c6-b9b9-12cede8bd48f)

![Hue Histogram](https://565437294-files.gitbook.io/~/files/v0/b/gitbook-legacy-files/o/assets%2F-MFqn5MuayPgQPMZ9pwf%2F-MG0ZF6QsbE5exszd6wP%2F-MG0ZxM5MHCKDpMw1JEr%2FScreenshot%202020-08-31%20at%2000.52.00.jpg?alt=media\&token=6846db2f-e2ce-4dd6-bcdd-6b9e9e219ddb)

![Saturation Histogram](https://565437294-files.gitbook.io/~/files/v0/b/gitbook-legacy-files/o/assets%2F-MFqn5MuayPgQPMZ9pwf%2F-MG0ZF6QsbE5exszd6wP%2F-MG0_1-yocQCerXv_MFV%2FScreenshot%202020-08-31%20at%2000.52.05.jpg?alt=media\&token=4601303d-836f-4381-92cb-8bfed6ca6e5f)

## Masking

Histogram can be used directly to define mask ranges.

![](https://565437294-files.gitbook.io/~/files/v0/b/gitbook-legacy-files/o/assets%2F-MFqn5MuayPgQPMZ9pwf%2F-MG0ZF6QsbE5exszd6wP%2F-MG0_t3KEwlySu3tnkBt%2FScreenshot%202020-08-31%20at%2000.53.01.jpg?alt=media\&token=9a0cda40-6299-4c9c-8575-36f7d35270bf)

| Input            | Action                                                                                             |
| ---------------- | -------------------------------------------------------------------------------------------------- |
| **Alt + hover**  | Show precise value/frequency readout under cursor                                                  |
| **Click + drag** | Select a range and write it to the active mask domain; dragging can continue beyond the plot edges |

Mask target by mode:

* **RGB / Luma**: luma range mask
* **Hue**: hue mask
* **Saturation**: saturation mask

Combine this with shape masks from [Source Signal](/nobe-omniscope/scopes/source-signal) for full qualifier workflows.

![Combined masking](https://565437294-files.gitbook.io/~/files/v0/b/gitbook-legacy-files/o/assets%2F-MFqn5MuayPgQPMZ9pwf%2F-MG3ORpZ8_0p-5etnTpu%2F-MG3OjVxD7R2dfVEjxoS%2F03_combined_masking.gif?alt=media\&token=73886991-2b0c-48eb-9540-c0d90cf02a54)

## Appearance

| Setting                   | Description                                              |
| ------------------------- | -------------------------------------------------------- |
| **Fill Opacity**          | Fill intensity from none to 100%                         |
| **Render histogram edge** | Outline the histogram curve                              |
| **Show gradient**         | Draw color gradient in the background                    |
| **Frequency scale**       | Choose Fit, Auto detail, or Log scaling                  |
| **Hold scale**            | Keep the current frequency reference for shot comparison |
| **Gain**                  | Magnify the displayed curve from 25% to 2000%            |
| **Smooth Graph**          | Smooth curve rendering                                   |

## Custom Reference Lines

Up to four custom reference lines are supported.

Per line:

* Enable/disable line
* Set value in current scale
* Set line color

These are useful for recurring deliverable limits or internal targets.

## Example Views

![Vertical histogram orientation](https://565437294-files.gitbook.io/~/files/v0/b/gitbook-legacy-files/o/assets%2F-MFqn5MuayPgQPMZ9pwf%2F-MG0aTz9gR5aTyEQDb6Q%2F-MG0arfTPQh4fgjwtXCQ%2FScreenshot%202020-08-31%20at%2001.01.51.jpg?alt=media\&token=38d7b028-30d8-4924-88fc-0b71658d24db)


# False Color

False Color maps luma, chroma, saturation, or hue values to a color overlay, making it easy to judge exposure and color relationships at a glance. Every color band and its threshold can be fully customized.

<figure><img src="https://565437294-files.gitbook.io/~/files/v0/b/gitbook-x-prod.appspot.com/o/spaces%2F-MFqn5MuayPgQPMZ9pwf%2Fuploads%2Fgit-blob-547c92559dd8ec45d03720baac50b53d6df065fc%2F2026-02_false-color.jpg?alt=media" alt=""><figcaption><p>False Color scope with the R3D preset</p></figcaption></figure>

## Display Modes

| Mode                 | Description                                                                                                                                                                                                               |
| -------------------- | ------------------------------------------------------------------------------------------------------------------------------------------------------------------------------------------------------------------------- |
| **Luma**             | Maps luma (Y') to false color (default). Luma is the weighted sum of the non-linear R'G'B' channels; the weights follow the active color space (Rec. 709: 0.2126 / 0.7152 / 0.0722; Rec. 2020: 0.2627 / 0.6780 / 0.0593). |
| **HDR**              | HDR-aware mode with dedicated, spec-aligned presets for **PQ** (SMPTE ST 2084) and **HLG** (ITU-R BT.2100 / BT.2408) signals. Scale labels are shown in display-referred nits. See [HDR Mode](#hdr-mode) below.           |
| **Saturation (HSL)** | Maps HSL saturation to false color                                                                                                                                                                                        |
| **Saturation (HSV)** | Maps HSV saturation to false color                                                                                                                                                                                        |
| **Chroma**           | Maps channel spread (`max(R,G,B) - min(R,G,B)`) to false color. Useful when you want a DCTL-style saturation heat map based on chroma rather than HSL/HSV saturation.                                                     |
| **Hue**              | Maps hue angle to false color                                                                                                                                                                                             |

## Built-in Presets

OmniScope ships with 21 built-in false color presets covering common camera and monitor workflows:

| Preset                      | Style                             |
| --------------------------- | --------------------------------- |
| **R3D**                     | Smooth — RED cameras (default)    |
| **R3D Legacy (v2.x)**       | Gradient — older RED workflow     |
| **Flanders**                | Gradient — professional reference |
| **SmallHD (50x, 70x)**      | Gradient                          |
| **SmallHD (DPx)**           | Gradient                          |
| **ARRI**                    | Sharp                             |
| **Atomos**                  | Sharp                             |
| **Atomos 2**                | Sharp                             |
| **BlackMagic Video Assist** | Smooth                            |
| **Zacuto**                  | Sharp                             |
| **VideoDevices PIX-E4**     | Smooth                            |
| **VideoDevices PIX-E12**    | Smooth                            |
| **Skintones**               | Smooth — skin tone reference      |
| **Highlights**              | Smooth — highlight range focus    |
| **Shadows**                 | Smooth — shadow range focus       |
| **Saturation**              | Gradient — saturation mapping     |
| **Sony Log**                | Sharp — S-Log3 style              |
| **Canon Log**               | Sharp — C-Log3 style              |
| **RED Log**                 | Sharp — IPP2 style                |
| **ARRI LogC4**              | Sharp — LogC4 curve               |
| **Universal Cine Log**      | Sharp — universal log standard    |

<figure><img src="https://565437294-files.gitbook.io/~/files/v0/b/gitbook-x-prod.appspot.com/o/spaces%2F-MFqn5MuayPgQPMZ9pwf%2Fuploads%2Fgit-blob-d5d0a4d090fc5dc74d517e1be2674cf3b845c158%2F2026-02_false-color-presets-menu.jpg?alt=media" alt=""><figcaption><p>Preset selection menu</p></figcaption></figure>

Each preset defines up to 15 color stops with configurable transition sharpness — **Smooth** (continuous gradient), **Sharp** (hard color cuts), or **Gradient** (mixed).

## Preset Manager

The Preset Manager lets you browse, import, and organize false color presets. It lists both **built-in presets** and **user presets** stored in the application support folder. You can load presets from `.tfc4` / `.fc4` files on disk, save custom presets, rename, or delete user presets.

<figure><img src="https://565437294-files.gitbook.io/~/files/v0/b/gitbook-x-prod.appspot.com/o/spaces%2F-MFqn5MuayPgQPMZ9pwf%2Fuploads%2Fgit-blob-852f52396009b9f4c104b1a049abc19f4969873a%2F2026-02_false-color-presets.jpg?alt=media" alt=""><figcaption><p>False Color Preset Manager</p></figcaption></figure>

User presets are stored in `~/Library/Application Support/NobeOmniScope/presets/` on macOS.

## Scale

A color ruler displays the active preset's mapping alongside the image. The scale type determines the unit labels:

| Scale            | Description              |
| ---------------- | ------------------------ |
| **IRE**          | Standard broadcast units |
| **8-bit**        | 0–255 levels             |
| **10-bit**       | 0–1023 levels            |
| **mV**           | Millivolts (analog)      |
| **ST 2084 (PQ)** | HDR nit levels           |
| **HLG**          | HLG nit levels           |

### Side Scale

Move the scale outside the picture area so it doesn't cover the image. Toggle **Scale on side** in the scope settings.

<figure><img src="https://565437294-files.gitbook.io/~/files/v0/b/gitbook-x-prod.appspot.com/o/spaces%2F-MFqn5MuayPgQPMZ9pwf%2Fuploads%2Fgit-blob-c5916ca5a09741fac25fbc86c92981adf3ca2722%2F2026-02_false-color-side-scale.jpg?alt=media" alt=""><figcaption><p>Side scale keeps the image unobstructed</p></figcaption></figure>

## HDR Mode

{% hint style="info" %}
HLG false-color support and the BT.2408-aligned HDR presets are available from version **1.11.45**.
{% endhint %}

Selecting **Mode → HDR** switches False Color to a pair of spec-aligned presets for HDR signals. Use the **Scale** selector to pick between **PQ** (SMPTE ST 2084) and **HLG** (ITU-R BT.2100 / BT.2408).

In HDR mode the scale labels are display-referred nits: PQ labels are absolute (PQ is absolute-nit encoded); HLG labels are computed through the BT.2100 system gamma (γ = 1.2 at reference L<sub>w</sub> = 1000 nits), so they match BT.2408 operational practice (75 % HLG → 203 nits, 38 % HLG → 26 nits, 100 % HLG → 1000 nits).

### HLG Preset (BT.2408)

<figure><img src="https://565437294-files.gitbook.io/~/files/v0/b/gitbook-x-prod.appspot.com/o/spaces%2F-MFqn5MuayPgQPMZ9pwf%2Fuploads%2Fgit-blob-7d32ced5aaf6618de072df52c3a2bfdf5739b3fe%2F2026-04_false-color-hlg.jpg?alt=media" alt=""><figcaption><p>HLG preset with BT.2408 reference bands: cyan 18 % gray marker, pink skin-tone zone, green ref-white anchor, yellow/orange specular warning, red peak</p></figcaption></figure>

The HLG preset anchors the three BT.2100 structural points — **0 % black**, **75 % HLG diffuse / graphics white (203 nits)**, and **100 % peak display (1000 nits)** — as locked indicators, and surrounds them with BT.2408-aligned reference bands: a **cyan** marker at the **18 % gray card (38 % HLG ≈ 26 nits)**, a **pink** band across the **Fitzpatrick skin-tone range (45 – 60 % HLG ≈ 39 – 85 nits)**, and a specular-highlight warning ramp above diffuse white. Cyan is chosen over green for the 18 % gray marker so it's visually distinct from the green reference-white anchor.

| HLG signal % | Display nits @ L<sub>w</sub> 1000 | Color                       | Purpose                            | BT.2408                       |
| -----------: | --------------------------------: | --------------------------- | ---------------------------------- | ----------------------------- |
|            0 |                                 0 | black (locked)              | Floor                              | —                             |
|       0 → 17 |                           0 → 3.8 | black → dark gray ramp      | Shadow noise floor                 | —                             |
|      17 → 36 |                          3.8 → 23 | mid-gray ramp               | Shadow                             | —                             |
|  **36 → 40** |                       **23 → 30** | **cyan band** (sharp edges) | **18 % gray marker**               | **38 % = 26 nits**            |
|      40 → 45 |                           30 → 39 | gray                        | Lower mid                          | —                             |
|  **45 → 60** |                       **39 → 85** | **pink band** (sharp edges) | **Skin-tone zone**                 | Fitz 1–6 range (Table 2)      |
|      60 → 75 |                          85 → 203 | gray ramp                   | Upper mid → ref white              | —                             |
|       **75** |                           **203** | **green (locked)**          | **HLG Reference / Graphics White** | **75 % = 203 nits**           |
|      75 → 82 |                         203 → 314 | green                       | Lower specular                     | —                             |
|      82 → 88 |                         314 → 459 | green → yellow gradient     | Highlight warning                  | —                             |
|       **88** |                           **459** | **yellow (sharp)**          | **Highlight alert**                | —                             |
|      88 → 95 |                         459 → 722 | yellow → orange             | Near peak                          | —                             |
|     95 → 100 |                        722 → 1000 | orange → red                | Approaching peak                   | —                             |
|      **100** |                          **1000** | **red (locked)**            | **Peak Display**                   | **100 % = L**<sub>**w**</sub> |

Because HLG is display-adaptive, the color anchors are expressed in signal %, not absolute nits — they stay fixed regardless of the mastering display peak. Only the nit labels on the ruler rescale if you change the reference L<sub>w</sub>.

The **Mastering level** and **SDR white level** controls are disabled when the scale is set to HLG — BT.2100 locks HLG reference white and peak at 75 % and 100 % signal regardless of display peak.

### PQ Preset (BT.2408)

<figure><img src="https://565437294-files.gitbook.io/~/files/v0/b/gitbook-x-prod.appspot.com/o/spaces%2F-MFqn5MuayPgQPMZ9pwf%2Fuploads%2Fgit-blob-3377f3e1769902061968ce0cd13d986782733e72%2F2026-04_false-color-pq.jpg?alt=media" alt=""><figcaption><p>PQ preset with BT.2408 reference bands and mastering-relative highlight warnings (yellow at 0.5× mastering, orange at 0.75× mastering)</p></figcaption></figure>

The PQ preset shares the HLG preset's visual grammar — the same BT.2408 reference bands (18 % gray and skin-tone), the same green-locked HDR reference-white anchor at 203 nits, and a specular warning ramp that **rescales with the user's mastering level**. Because PQ is absolute-nit encoded, all thresholds below 203 nits are expressed in absolute nits (they don't move with the mastering slider); the specular ramp above 203 nits tracks the mastering level so a 4000-nit Dolby Vision master puts the warnings in the right place automatically.

The table below assumes the default mastering level = 1000 nits. The two "mastering-relative" rows (highlight warn and near peak) move proportionally when the slider changes — e.g. on a 4000-nit master, highlight warn lands at 2000 nits and near peak at 3600 nits.

|     Nits @ 1000 mastering | PQ signal % | Color                       | Purpose                                 | BT.2408                    |
| ------------------------: | ----------: | --------------------------- | --------------------------------------- | -------------------------- |
|                         0 |         0.0 | black (locked)              | Floor                                   | —                          |
|                     0 → 4 |      0 → 23 | black → dark gray ramp      | Shadow noise floor                      | —                          |
|                    4 → 23 |     23 → 37 | mid-gray ramp               | Shadow                                  | —                          |
|               **23 → 30** | **37 → 39** | **cyan band** (sharp edges) | **18 % gray marker**                    | **26 nits ≈ 38 % signal**  |
|                   30 → 40 |     39 → 42 | gray                        | Lower mid                               | —                          |
|               **40 → 85** | **42 → 49** | **pink band** (sharp edges) | **Skin-tone zone**                      | Fitz 1–6 range (Table 2)   |
|                  85 → 203 |   49 → 57.5 | gray ramp                   | Upper mid → ref white                   | —                          |
|                   **203** |    **57.5** | **green (locked)**          | **HDR Reference / Graphics White**      | **203 nits = 58 % signal** |
| **500** (0.5 × mastering) |        ≈ 67 | **yellow (sharp)**          | **Highlight warn** (tracks mastering)   | —                          |
| **900** (0.9 × mastering) |        ≈ 74 | **orange**                  | **Near peak** (tracks mastering)        | —                          |
|      **1000** (mastering) |    **74.7** | **red (locked)**            | **Mastering level** (user-configurable) | —                          |
|                     10000 |       100.0 | red (locked)                | ST 2084 ceiling                         | —                          |

The **Mastering level** slider (1000 – 10000 nits) lets a colorist change their grade target on the fly — the red anchor, the yellow highlight warn, and the orange near-peak indicator all shift together, keeping the warnings proportional to the deliverable. The **SDR white level** combo (100 / 203 / 300 nits) moves the green locked anchor, which is useful when conforming to non-BT.2408 ingest styles (e.g. 100-nit SDR-pass-through material).

Unlike HLG, PQ absolute nits differ from PQ signal-%: the PQ curve allocates more of the scale to shadows (10 nits = 38 % signal; 100 nits = 51 % signal). That's why the 18 % gray and skin-tone bands end up proportionally narrower on the PQ scale than on HLG — both are BT.2408-correct in nits; they just land differently on the signal axis.

## Opacity & Blur

* **Opacity** (0–100 %) — blend the false color overlay with the original image for a semi-transparent view.
* **Blur** — soften the false color output to reduce noise in the mapping.

## Custom Range

Enable **Custom Range** to override the full preset with a simple two-color gradient between a minimum and maximum level. Set the min/max percentages and pick the start and end colors.

## Ranges

{% hint style="info" %}
Available from version **1.11.33**.
{% endhint %}

The **Ranges** tab in False Color settings provides numerical editing for every range point in the active preset. Each range boundary is displayed as a slider with its current IRE value. **Cmd-click** (macOS) or **Ctrl-click** (Windows) a slider to turn it into an edit box and type an exact value.

<figure><img src="https://565437294-files.gitbook.io/~/files/v0/b/gitbook-x-prod.appspot.com/o/spaces%2F-MFqn5MuayPgQPMZ9pwf%2Fuploads%2Fgit-blob-e109ccc6c29ed61f113359a797c3a9ebea4b4c68%2F2026-03_false-color-ranges.jpg?alt=media" alt=""><figcaption><p>Ranges tab — fine-tune each preset range with precise IRE values</p></figcaption></figure>

The **Minimum** and **Maximum** range points are locked to 0 and 100 IRE respectively. All other range boundaries can be adjusted freely within their allowed range (constrained by neighbouring points).

This is the same set of range points you can drag directly on the false color scale — the Ranges tab simply gives you precise numerical control.

## Color Picker

Hold **Alt** and click on the image to sample a color and create a **color pin**. Pins display the sampled value in your chosen format:

| Format        | Example          |
| ------------- | ---------------- |
| **RGB 8-bit** | R:255 G:128 B:64 |
| **HEX**       | #FF8040          |
| **RGB Float** | 1.0, 0.5, 0.25   |

## Zoom & Pan

Scroll to zoom in (up to 15×), then hold **Space** and left-click drag to pan across the image. A **zoom preview** thumbnail appears in the corner showing the full frame with a yellow rectangle indicating the current viewport. The preview can be toggled off in settings.

## LUT Export

Export the current false color mapping as a standard **3D LUT** (`.cube`) or **VLT** format for use in external applications or on-set monitors.

## Keyboard Shortcuts

Assign shortcuts via the [Action Editor](/nobe-omniscope/action-editor) to any of the actions below.

## StreamDeck Actions

| Action          | Description                           |
| --------------- | ------------------------------------- |
| **Toggle Solo** | Fullscreen the False Color scope      |
| **Pause**       | Freeze the scope at the current frame |


# Skintone Scope

## Overview

The SkinTone Scope is a specialized tool for monitoring skin tones. It creates a color qualifier targeting only the skin tone range, offering precision in color grading.

<figure><img src="https://565437294-files.gitbook.io/~/files/v0/b/gitbook-x-prod.appspot.com/o/spaces%2F-MFqn5MuayPgQPMZ9pwf%2Fuploads%2Fgit-blob-a2c902b913c991e2e9d36b49eee16f6cbbf04bcd%2F2023-12_st_settings.jpg?alt=media" alt=""><figcaption><p>SkinTone Scope settings</p></figcaption></figure>

## Color Models

The SkinTone Scope features two color models:

* **HSV** (Hue, Saturation, Value) — Ideal for intuitive adjustments because it separates color (hue) from the non-color brightness channel (value).
* **Y'CbCr** (Luma, Blue-Difference Chroma, Red-Difference Chroma) — Suited for broadcast workflows, working directly on the signal's luma (Y') and color-difference (Cb, Cr) components. Note that Y' is luma, not scene luminance — it's computed from the non-linear R'G'B' signal.

### Hue detection range

In the hue-based model, the Hue Detection slider is a normalized control over a limited skin-tone hue window, not the full 0–360° hue wheel. The 0.0 to 1.0 slider range maps to a 144° span around the red/skin-tone region:

```
hue angle = (144 × slider value - 72) mod 360
```

This means:

```
0.00 = 288°
0.25 = 324°
0.50 =   0° / 360°
0.75 =  36°
1.00 =  72°
```

The default Hue Detection bounds of 0.42 to 0.70 represent approximately 348.5° to 28.8°, wrapping through 0°.

<figure><img src="https://565437294-files.gitbook.io/~/files/v0/b/gitbook-x-prod.appspot.com/o/spaces%2F-MFqn5MuayPgQPMZ9pwf%2Fuploads%2Fgit-blob-8a9c7ecd58aaedc215001b66e27d5620dbee92aa%2F2023-12_skintone_overlays.gif?alt=media" alt=""><figcaption><p>SkinTone overlay modes</p></figcaption></figure>

## Auto Find Range (1.11.50+)

**Auto Find Range** detects a face in the current frame and configures the SkinTone detection range automatically from that face's skin pixels — no manual slider tweaking required. One click sets both the HSV and Y'CbCr windows (hue, saturation/chroma, and luma) from what it measured.

You can trigger it three ways:

* From the **scope settings panel** (the *Auto Find Range* button).
* From the **scope context menu** (right-click the scope).
* From a custom **keyboard** or **Stream Deck** action (`SkinToneAutoFindRange`).

<figure><img src="https://565437294-files.gitbook.io/~/files/v0/b/gitbook-x-prod.appspot.com/o/spaces%2F-MFqn5MuayPgQPMZ9pwf%2Fuploads%2Fgit-blob-ff623c2d6b062879aa762f1d136fb15d77b18fb7%2F2026-07_st_autofind_menu.jpg?alt=media" alt=""><figcaption><p>Auto Find Range in the scope context menu</p></figcaption></figure>

When it runs, a fading **cyan outline** (the detected face rectangle plus the sampled ellipse) confirms what was detected. The outline tracks zoom and pan so you can verify the pick.

<figure><img src="https://565437294-files.gitbook.io/~/files/v0/b/gitbook-x-prod.appspot.com/o/spaces%2F-MFqn5MuayPgQPMZ9pwf%2Fuploads%2Fgit-blob-ee60fdb09ddb0be6ebbc61da3db27455c3b29bc0%2F2026-07_st_autofind_result.jpg?alt=media" alt=""><figcaption><p>The detected face and the range derived from its skin tones</p></figcaption></figure>

If several people are in frame, Auto Find Range picks the **largest face**. Candidates are tried largest-first and each must yield a valid skin-tone window, so detector false positives (e.g. foliage) are rejected in favor of a real face.

<figure><img src="https://565437294-files.gitbook.io/~/files/v0/b/gitbook-x-prod.appspot.com/o/spaces%2F-MFqn5MuayPgQPMZ9pwf%2Fuploads%2Fgit-blob-a67ba65f32472dc7e522938d6f5f860df23867e0%2F2026-07_st_autofind_multiface.jpg?alt=media" alt=""><figcaption><p>With multiple faces, the largest one is used</p></figcaption></figure>

Face detection uses **Apple Vision** on macOS and a bundled detector on Windows, and runs on a worker thread so it never stalls the render loop.

## Wide Hue Range (1.11.50+)

Heavily graded or stylized footage (for example a cold teal grade or neon lighting) can push skin chroma far outside the standard skin-tone hue band, leaving a face unselectable at any slider setting. **Wide hue range** maps the sliders across the full color wheel in both color models so those tones can be qualified.

Toggling it remaps the current sliders so your selected window stays in place. **Auto Find Range enables Wide hue range automatically** when the detected face's tones fall outside the standard windows — so on stylized shots a single click both finds the face and widens the range for you.

<figure><img src="https://565437294-files.gitbook.io/~/files/v0/b/gitbook-x-prod.appspot.com/o/spaces%2F-MFqn5MuayPgQPMZ9pwf%2Fuploads%2Fgit-blob-0ac5eb7d44af880400a475adcfa43ab138fddcef%2F2026-07_st_wide_hue.jpg?alt=media" alt=""><figcaption><p>Wide hue range qualifying skin under heavy neon grading</p></figcaption></figure>

## Features

* **Luma and Saturation Range** — Narrow the range for finer control over skin tones.
* **Skin Hue Guide** (1.11.50+) — The default overlay. Selected pixels are colored **yellow** when they sit within tolerance of the target skin-tone hue, **magenta** below it, and **green** above — a quick visual for how well skin aligns to the target. This is the overlay shown in the Auto Find Range examples above.
* **Overlay Modes** — Additional visualization options: grid, solid color, or a custom gradient between two selected colors.
* **Global Mask** — Apply the skin tone selection as a global mask so all scopes display only the skin tone areas from the active image.

<figure><img src="https://565437294-files.gitbook.io/~/files/v0/b/gitbook-x-prod.appspot.com/o/spaces%2F-MFqn5MuayPgQPMZ9pwf%2Fuploads%2Fgit-blob-b0ca19a57934aecea760c015fe4cfb8e705dbdd7%2F2023-12_st_mask.jpg?alt=media" alt=""><figcaption><p>Global mask applied to all scopes</p></figcaption></figure>

* **Low-Pass Filter** — Smooth out the selection for a more natural look.

Achromatic pixels such as pure grays, black, or white are excluded from SkinTone detection, so neutral highlights and shadows are not treated as skin.

## Presets (1.11.52+)

Save the current Skin Tone setup — detection range, filtering, overlay, and mask settings — as a named preset and recall it in any session. This is handy for switching between talent, lighting setups, or show-specific looks without re-tuning the sliders.

Presets are available from the **Presets** menu in the scope context menu, and from the **Presets** section of the scope settings window:

* **Save Current As...** — store the current settings under a name.
* Click a preset name to load it.
* **Delete Preset** — remove a saved preset.
* **Reload Presets** — rescan the preset folder, e.g. after copying preset files from another machine.

Saved presets are included in [configuration exports](/nobe-omniscope/layouts/backup-and-transfer), so they travel with your setup when you move to another workstation.

## 3-Color Mode with Sharp Transitions (1.10.139+)

Adds a three-color overlay mode with sharp transitions for quick pass/fail matching of skin tones.


# Neutral Scope

The Neutral Scope helps identify areas of your image that should be neutral (gray) but may have a color cast. It's particularly useful for white balance verification and color correction.

<figure><img src="https://565437294-files.gitbook.io/~/files/v0/b/gitbook-x-prod.appspot.com/o/spaces%2F-MFqn5MuayPgQPMZ9pwf%2Fuploads%2Fgit-blob-9cd81d47142534b4e93d8224ff8880391bbb2652%2F2026-02_neutral-scope.jpg?alt=media" alt=""><figcaption><p>Neutral Scope highlighting near-neutral pixels</p></figcaption></figure>

## Overview

The Neutral Scope analyzes your video signal to highlight pixels that are close to neutral but exhibit a slight color bias. This makes it easy to:

* Verify white balance accuracy
* Identify subtle color casts in gray areas
* Check that neutral objects (white walls, gray cards) are truly neutral

## How It Works

The scope examines each pixel's RGB values and calculates how far they deviate from perfect neutrality (where R=G=B). Areas with minimal deviation are highlighted, allowing you to see if they lean toward any particular hue.

## Settings

Access scope settings via the hamburger menu (☰) or right-click on the scope.

| Setting      | Description                                         | Default |
| ------------ | --------------------------------------------------- | ------- |
| Luma Range   | Limit analysis to a specific luma (Y') band         | Full    |
| Threshold    | How close to neutral a pixel must be to be included | 5 %     |
| Display Mode | Overlay or isolated view                            | Overlay |

### Luma Range

Limit the analysis to shadows, midtones, or highlights:

* **Full**: Analyze the entire tonal range
* **Shadows**: Focus on dark areas — black-level neutrality is often where camera sensor noise introduces color bias
* **Midtones**: Focus on middle gray, where human perception is most sensitive to color casts
* **Highlights**: Focus on bright areas — white balance is traditionally anchored here (a white card or light source)

## Use Cases

### White Balance Verification

Point the scope at a gray card or neutral reference to verify your white balance is correct. Any color bias will be immediately visible.

### Finding Color Casts

When color correcting footage, use the Neutral Scope to identify subtle casts that may not be obvious in the source viewer.

### Checking Skin Tones

While skin tones are not neutral, areas like the whites of eyes or teeth should be close to neutral. The scope can help identify unwanted color contamination.

## Tips

* Use a gray card or color chart as a reference when possible
* Combine with the Vectorscope for comprehensive color analysis
* The threshold setting lets you adjust sensitivity to your needs

## Related Scopes

* [Vectorscope](/nobe-omniscope/scopes/vectorscope) - Overall chroma analysis
* [Skintone Scope](/nobe-omniscope/scopes/skintone-scope) - Skin tone line analysis
* [Waveform](/nobe-omniscope/scopes/waveform) - RGB parade for balance checking


# TwinPeaks

{% hint style="info" %}
This scope requires a **Pro** license.
{% endhint %}

TwinPeaks is a diamond-style RGB channel relationship scope. It is inspired by the double-diamond displays used in broadcast waveform monitors and helps you see how the red, green, and blue channels relate to each other across the image.

Use it for camera matching, white-balance and black-balance checks, channel imbalance diagnosis, creative grade analysis, and RGB gamut monitoring.

If you place color pins, TwinPeaks shows those sampled colors on both diamonds so you can compare the channel relationships of specific pixels directly. (1.11.52+)

<figure><img src="https://565437294-files.gitbook.io/~/files/v0/b/gitbook-x-prod.appspot.com/o/spaces%2F-MFqn5MuayPgQPMZ9pwf%2Fuploads%2Fgit-blob-dfa71d8ec408baff5f3465643b3e4d1cc75c2540%2F2026-02_twinpeaks.jpg?alt=media" alt=""><figcaption><p>TwinPeaks double-diamond display</p></figcaption></figure>

## How It Works

TwinPeaks is built from two channel plots transformed into a double-diamond layout:

* **Upper diamond**: green / blue relationship
* **Lower diamond**: green / red relationship

The two diamonds meet at the center. When the RGB channels track closely together, the trace tends to stay narrow and centered through the diamonds. When channels separate, the trace leans, widens, or moves toward one side.

That separation can indicate a color cast, camera mismatch, white-balance offset, black-balance issue, creative channel split, or an RGB gamut excursion.

## Reading The Trace

| Trace behavior                       | What it can indicate                                                   |
| ------------------------------------ | ---------------------------------------------------------------------- |
| Narrow, centered trace               | RGB channels are tracking closely together                             |
| Leaning trace                        | Possible channel imbalance or color cast                               |
| Different shape between cameras      | Camera matching, shading, or color-science mismatch                    |
| Swept or curved trace                | Creative channel separation, split-tone grading, or strong hue shaping |
| Trace outside the diamond boundaries | Possible RGB gamut excursion                                           |

Interpret TwinPeaks together with the image and other scopes. The display makes channel relationships easier to see, but the meaning of a trace still depends on the picture content.

## Camera Matching

TwinPeaks is useful when comparing multiple cameras or live feeds. Matched cameras should produce similar trace shapes under the same lighting and subject conditions.

If one camera leans differently, offsets in part of the tonal range, or produces a noticeably wider/narrower trace than the others, it can point to:

* White-balance mismatch
* Black-balance mismatch
* RGB gain or bias difference
* Camera shading difference
* Sensor or color-science mismatch

Use TwinPeaks alongside the waveform, RGB parade, vectorscope, and picture monitor for a more complete match.

## Gamut Monitoring

The diamond boundaries act as reference limits for valid RGB channel relationships. When the trace extends outside those boundaries, that part of the signal may be outside accepted RGB gamut limits and may need correction for broadcast delivery.

TwinPeaks is especially helpful because it shows the relationship between RGB channels directly, rather than only showing luma or chroma in isolation.

## Trace Presentation

Access scope settings via the hamburger menu (☰) or right-click on the scope.

| Setting                  | Description                                                           |
| ------------------------ | --------------------------------------------------------------------- |
| **Flip Axes**            | Swap the plotted axes to mirror the diamond layout                    |
| **Colorize**             | Tint the trace using source color instead of drawing it monochrome    |
| **Enhanced Render**      | Use line rendering instead of a dense point cloud                     |
| **Smooth Trace**         | Enable the post-process pass for a smoother trace                     |
| **Enhance Edges**        | Increase ridge contrast to make subtle trace boundaries easier to see |
| **Gain**                 | Adjust master trace brightness                                        |
| **Color space override** | Override the color space used for the RGB/Y'CbCr conversion pipeline  |

<figure><img src="https://565437294-files.gitbook.io/~/files/v0/b/gitbook-x-prod.appspot.com/o/spaces%2F-MFqn5MuayPgQPMZ9pwf%2Fuploads%2Fgit-blob-cac93e9348e243a54bb0fc2a67046237d924bd37%2F2026-02_twinpeaks-2.jpg?alt=media" alt=""><figcaption><p>TwinPeaks trace presentation options</p></figcaption></figure>

## Tips

* Use a neutral chart or controlled reference shot when matching cameras.
* Compare trace shape between sources, not just the absolute position of one trace.
* Treat strong lean or widening as a prompt to investigate channel separation, not as a final diagnosis by itself.
* Use the RGB parade to confirm which channel is high or low after TwinPeaks shows that something is separating.
* Use the vectorscope to inspect hue/saturation behavior after TwinPeaks reveals channel relationship differences.

## Related Scopes

* [Channel Plot](/nobe-omniscope/scopes/channel-plot) - X/Y plots of selected channel pairs
* [Waveform](/nobe-omniscope/scopes/waveform) - Luma, RGB, YRGB, and Y'CbCr level analysis
* [Vectorscope](/nobe-omniscope/scopes/vectorscope) - Hue and saturation analysis
* [Histogram](/nobe-omniscope/scopes/histogram) - Value distribution and clipping checks

## See It In Practice

* [How a Professional Colorist Uses Nobe OmniScope Every Day](https://timeinpixels.com/blog/how-darren-uses-omniscope) - Darren Mostyn's real-world TwinPeaks, False Color, and custom layout walkthrough


# Channel Plot

The channel plot lets you render two channels on an X/Y axis.

You can select from the below channel combinations:

* R / G
* R / B
* G / B
* Y / Cb
* Y / Cr
* Cb / Cr

![R / G channel plot](https://565437294-files.gitbook.io/~/files/v0/b/gitbook-legacy-files/o/assets%2F-MFqn5MuayPgQPMZ9pwf%2F-MJiAYZ5N__q0fsyGE97%2F-MJiB_7MvNvRUq27N6ps%2FScreenshot%202020-10-15%20at%2023.33.53.jpg?alt=media\&token=82f6f77b-07a3-4fb4-b9f0-bf97653b56a9)

![Y / Cr channel plot](https://565437294-files.gitbook.io/~/files/v0/b/gitbook-legacy-files/o/assets%2F-MFqn5MuayPgQPMZ9pwf%2F-MJiAYZ5N__q0fsyGE97%2F-MJiBeXA_ts8DQok9L1O%2FScreenshot%202020-10-15%20at%2023.34.15.jpg?alt=media\&token=61273b83-9fce-446c-b708-78f64c39efef)


# Error Logger

Error Logger is a real-time event report for QC sessions.

You can define legal ranges for your signal, start a logging session, and review every detected violation in a timestamped list.

The ranges for gamut checking can be configured in **Help / QC Gamut Check**:

![QC Gamut Check](https://565437294-files.gitbook.io/~/files/v0/b/gitbook-legacy-files/o/assets%2F-MFqn5MuayPgQPMZ9pwf%2F-MJiBhm71jo7aNnt-n8r%2F-MJiC75zb3pAjb-MK9LF%2FScreenshot%202020-10-15%20at%2023.39.42.jpg?alt=media\&token=da748542-0e73-4faf-8f25-c411394f5069)

Once **Gamut Check** is enabled and an **Error Logger** session is started, OmniScope records detected events in the list.

Gamut Check analyzes the source frame without any modifications. It's in original resolution, before the [crop](/nobe-omniscope/features/crop) or aspect ratio is applied.

![](https://565437294-files.gitbook.io/~/files/v0/b/gitbook-legacy-files/o/assets%2F-MFqn5MuayPgQPMZ9pwf%2F-MJiBhm71jo7aNnt-n8r%2F-MJiCWHmEUwqSo4ePDPE%2FScreenshot%202020-10-15%20at%2023.35.10.jpg?alt=media\&token=a4c41fed-5343-485d-bce8-b369ae00a53a)

## Event Filters

The Error Logger can record and display multiple QC event types, including gamut violations, HDR gamut warnings, luminosity limit hits, blanking events, line-count errors, black frames, dead pixels, and audio silence.

Use the filter controls in the Error Logger scope to temporarily focus the list on the event types you want to review or export.

## Timecode Notes

Logged entries follow the active QC timeline timecode source when embedded timecode is present. If LTC is selected for the QC timeline, Error Logger entries use LTC; otherwise OmniScope falls back to VITC or the source time reference that is available.


# 3D Color Cube

The 3D Color Cube visualizes the color distribution of the signal in a three-dimensional space. Each pixel is plotted as a point in the selected color model, revealing clusters, gaps, and color casts that are hard to spot in 2D scopes.

If you use color pins, the 3D Color Cube also shows them as 3D markers inside the plot so you can see exactly where sampled colors sit in the current color model. (1.11.52+)

<figure><img src="https://565437294-files.gitbook.io/~/files/v0/b/gitbook-x-prod.appspot.com/o/spaces%2F-MFqn5MuayPgQPMZ9pwf%2Fuploads%2Fgit-blob-747fc7d0707b19388eead49b630b449934e3f5e9%2F2026-02_colorcube-cube.jpg?alt=media" alt=""><figcaption><p>3D Color Cube in RGB mode</p></figcaption></figure>

## Color Models

| Model       | Description                                                                                                                                                                                                                                                                                                                              |
| ----------- | ---------------------------------------------------------------------------------------------------------------------------------------------------------------------------------------------------------------------------------------------------------------------------------------------------------------------------------------- |
| **RGB**     | Red / Green / Blue axes forming a unit cube — the native color space of the signal                                                                                                                                                                                                                                                       |
| **CIE XYZ** | CIE 1931 tristimulus color space — `Y` is photometric luminance, `X` and `Z` are the other two matching-function outputs. Signal is converted from RGB to XYZ via the active color space's matrix.                                                                                                                                       |
| **CIE Lab** | Perceptually-uniform `L*a*b*` space derived from XYZ and a reference white (usually D65). `L*` is perceptual lightness; `a*` and `b*` encode the two chromatic opponent axes (red/green, yellow/blue). Unlike RGB or XYZ, equal distances in Lab correspond roughly to equal perceptual differences — which is why ΔE is computed there. |
| **CHL**     | Chroma / Hue / Lightness cylindrical projection derived from Lab — same perceptual data, just in polar form                                                                                                                                                                                                                              |
| **HSV**     | Hue / Saturation / Value cylindrical projection of RGB — convenient for content editing but not perceptually uniform                                                                                                                                                                                                                     |

<figure><img src="https://565437294-files.gitbook.io/~/files/v0/b/gitbook-x-prod.appspot.com/o/spaces%2F-MFqn5MuayPgQPMZ9pwf%2Fuploads%2Fgit-blob-fc6f081c0f13a97fc5879c46fe226f812adddae8%2F2026-02_colorcube-chl.jpg?alt=media" alt=""><figcaption><p>CHL (Chroma / Hue / Luminance) projection</p></figcaption></figure>

<figure><img src="https://565437294-files.gitbook.io/~/files/v0/b/gitbook-x-prod.appspot.com/o/spaces%2F-MFqn5MuayPgQPMZ9pwf%2Fuploads%2Fgit-blob-39ba19a7c450e47a2f10d7f02dc036339fa36644%2F2026-02_colorcube-hsv.jpg?alt=media" alt=""><figcaption><p>HSV cylindrical projection</p></figcaption></figure>

## Navigation

| Input            | Action        |
| ---------------- | ------------- |
| **Click + drag** | Rotate        |
| **Shift + drag** | Pan           |
| **Mouse wheel**  | Zoom in / out |
| **Double-click** | Reset view    |

## Settings

| Setting                | Description                                                 |
| ---------------------- | ----------------------------------------------------------- |
| **X / Y / Z Rotation** | Per-axis rotation controls for precise orientation          |
| **Point Size**         | Size of individual sample points                            |
| **Brightness**         | Overall trace brightness                                    |
| **Downsample**         | Reduce sample count for better performance on dense signals |

## Related

* [HectorScope (3D Waveform)](/nobe-omniscope/scopes/hectorscope)
* [Vectorscope](/nobe-omniscope/scopes/vectorscope)
* [Waveform](/nobe-omniscope/scopes/waveform)


# HectorScope

HectorScope is a **3D waveform visualization** tool that displays luma and chroma information together in a three-dimensional space. Named after its creator **Hector Berebi** — a working colorist and educator who teaches color theory through historical and perceptual framings — it provides a unique perspective on your video signal.

Where a classic waveform collapses the image to 2D (spatial position × level) and a vectorscope collapses it to 2D chroma (Cb × Cr), HectorScope plots all three of **Y' (luma)**, **Cb**, and **Cr** at once. Each pixel becomes a point in a 3D cube that you can rotate interactively. Patterns that are hidden in a 2D projection — a colored cast that only affects shadows, or a chroma outlier that sits inside the convex hull of the vectorscope trace — become obvious when you rotate the cube.

<figure><img src="https://565437294-files.gitbook.io/~/files/v0/b/gitbook-x-prod.appspot.com/o/spaces%2F-MFqn5MuayPgQPMZ9pwf%2Fuploads%2Fgit-blob-e02db7e15a2409174f04af75131c68e767a62bd8%2F2026-02_hectorscope-1.jpg?alt=media" alt=""><figcaption><p>HectorScope — 3D waveform visualization</p></figcaption></figure>

## Overview

Unlike traditional 2D waveforms, HectorScope renders your signal in 3D space, allowing you to:

* Visualize the relationship between luma and chroma together, not in separate scopes
* Identify color distributions that are hidden in 2D projections
* Examine shadow, midtone, and highlight regions from multiple angles

## Interface

The scope displays a 3D representation of your video signal that can be rotated and navigated interactively.

### Navigation

| Action     | Control           |
| ---------- | ----------------- |
| Rotate     | Click and drag    |
| Zoom       | Mouse wheel       |
| Pan        | Hold Shift + drag |
| Reset view | Double-click      |

## Settings

Access scope settings via the hamburger menu (☰) or right-click on the scope.

### Display Options

| Setting                      | Description                                                                                                                                                                 | Default |
| ---------------------------- | --------------------------------------------------------------------------------------------------------------------------------------------------------------------------- | ------- |
| Point Size                   | Size of individual sample points                                                                                                                                            | Auto    |
| Brightness                   | Overall brightness of the display                                                                                                                                           | 1.0     |
| Color Model                  | RGB or YCbCr color representation                                                                                                                                           | RGB     |
| Full source resolution (1:1) | Plot one unquantized 3D sample for every source pixel instead of using the reduced source image. This can significantly increase GPU load on UHD and 8K signals. (1.11.52+) | Off     |

### Rotation Controls

Per-axis rotation controls allow precise orientation of the 3D view:

| Setting    | Description       |
| ---------- | ----------------- |
| X Rotation | Tilt up/down      |
| Y Rotation | Rotate left/right |
| Z Rotation | Roll              |

<figure><img src="https://565437294-files.gitbook.io/~/files/v0/b/gitbook-x-prod.appspot.com/o/spaces%2F-MFqn5MuayPgQPMZ9pwf%2Fuploads%2Fgit-blob-bb7b951cd759413aac821814353e66a090708089%2F2026-02_hectorscope-2.jpg?alt=media" alt=""><figcaption><p>HectorScope rotated to inspect shadow detail</p></figcaption></figure>

## Use Cases

### Shadow Detail Analysis

Rotate the view to isolate shadow regions and examine noise or color contamination in dark areas.

### Highlight Rolloff

View the transition from midtones to highlights to ensure smooth rolloff without clipping.

### Color Balance

Examine the overall distribution of colors to identify unwanted color casts across tonal ranges.

## Tips

* Use in combination with the standard Waveform for comprehensive analysis
* Double-click to reset to the default view when navigating becomes disorienting
* Reduce point size for dense signals to see structure more clearly
* Enable **Full source resolution (1:1)** when you need exact per-pixel spatial placement in 3D, then switch it back off if playback or interaction becomes heavy

## Related Scopes

* [Waveform](/nobe-omniscope/scopes/waveform) - Traditional 2D waveform view
* [3D Color Cube](/nobe-omniscope/scopes/3d-color-cube) - 3D color space visualization
* [Vectorscope](/nobe-omniscope/scopes/vectorscope) - 2D chroma analysis


# Snapshot

Snapshot scope acts the same as Source Signal until you capture a frame. The captured frame can be used as a reference in any other scope.

## Capture and Reference

* Take a snapshot to freeze the current frame
* Use the snapshot as a reference source for other scopes

## Compare Modes

* Split and wipe overlays for quick comparisons (1.11.9+)
* Blend mode respects the configured alpha value (1.11.13+)
* Apply the input 3D LUT to the snapshot in split mode (1.11.17+)
* Option to take snapshots without [crop](/nobe-omniscope/features/crop) applied (1.11.9+)

![Snapshot Scope](https://565437294-files.gitbook.io/~/files/v0/b/gitbook-legacy-files/o/assets%2F-MFqn5MuayPgQPMZ9pwf%2F-MJiDCx5saRyMjwnXZS7%2F-MJiDYPNM3gU7ZGUaTK4%2Fimage.png?alt=media\&token=d15c517d-e1d9-4781-9ffa-0516ddf703e0)


# Timecode

![](https://565437294-files.gitbook.io/~/files/v0/b/gitbook-legacy-files/o/assets%2F-MFqn5MuayPgQPMZ9pwf%2F-MG0cZfnsDG98WCPA0oH%2F-MG0cypQzpGS7wiRaxl9%2FScreenshot%202020-08-31%20at%2001.10.04.jpg?alt=media\&token=9cc88275-4cb8-4977-8b6e-b591fd589d4c)


# Audio Meter

![Audio Meter](https://565437294-files.gitbook.io/~/files/v0/b/gitbook-legacy-files/o/assets%2F-MFqn5MuayPgQPMZ9pwf%2F-MG0cZfnsDG98WCPA0oH%2F-MG0d0fUBohlksY5_g-m%2FScreenshot%202020-08-31%20at%2001.11.11.jpg?alt=media\&token=916d4e75-8370-42b4-b145-a6b24097f0f4)

Audio meter features:

* Up to 32 audio channels
* Peak Hold option
* Configurable colors
* LUFS scale support (1.11.8+)

![](https://565437294-files.gitbook.io/~/files/v0/b/gitbook-legacy-files/o/assets%2F-MFqn5MuayPgQPMZ9pwf%2F-MGPv1Z1tHpeTdIEJfdo%2F-MGPv5r1aACEgT3nWFHN%2F04_audio.gif?alt=media\&token=c405a108-e819-4515-8e76-7b7f76e40096)

{% hint style="info" %}
Audio is supported through SDI/NDI, video files, and supported USB devices (1.11.25+). LUFS loudness metering is available on live inputs (SDI/NDI) as well as file sources.
{% endhint %}

### Monitoring Audio Channels

When a source has **Monitor audio** enabled, OmniScope can route only selected source channels to the monitor output for speaker or headphone checking.

* Use the numbered channel buttons in the source's **Source & monitoring** section to select which embedded channels you want to hear.
* When **Monitor audio** is enabled, each channel strip in the **Audio Meter** also gets an **S** solo button so you can audition that channel directly from the scope.
* The **Audio Meter** keeps showing all available channels even when monitored playback is limited to a subset.
* If no channels are selected, OmniScope plays the full mix, matching the previous default behavior.
* Use **Clear** to remove the current selection and return to full-mix monitoring.

### Scale Types

The Audio Meter Scope supports the following standards:

1. **dB** (Generic)
2. **dBFS** (Digital Full Scale)
3. **dBU** (Analog reference)
4. **LUFS** (Broadcast loudness compliance)
5. **VU** (Analog-style volume units)


# Goniometer

![](https://565437294-files.gitbook.io/~/files/v0/b/gitbook-legacy-files/o/assets%2F-MFqn5MuayPgQPMZ9pwf%2F-MHArU20IhxjjtrX3a59%2F-MHFbVBgy8Sk62k60mz7%2Fos_phase_meter.gif?alt=media\&token=0c0a9ae4-4fbf-4215-8794-08d4f4b540cb)

{% hint style="info" %}
Please note that Nobe OmniScope currently supports audio only through SDI & NDI.
{% endhint %}


# 3D LUT / ICC Profile

Use this scope to apply color transforms for preview or analysis.

## Supported Transforms

* 3D LUT
* 1D LUT (1.10.139+)
* ICC profiles

## Usage

1. Open the scope settings.
2. Load a LUT or ICC profile file.
3. Toggle the transform on/off to compare results.


# Text Display

Text Display is a text view where you can output any text and use some predefined TAGs.\
For example you can display the signal settings, current frame or audio parameters:

![](https://565437294-files.gitbook.io/~/files/v0/b/gitbook-legacy-files/o/assets%2F-MFqn5MuayPgQPMZ9pwf%2F-MJiCYevUVhLbhwoDiR_%2F-MJiCujci0ALr5MNrprO%2Fos_text_display.gif?alt=media\&token=9096b51e-480a-41e9-8f8f-8b31c9d5fed3)

Text Display has two source modes, selectable in the scope settings under **Source**:

* **Template** (default) — you type the text yourself and can embed the predefined TAGs described below.
* **External feed** — the scope shows live text published by an external tool or script through the `omniscope-text` command-line helper. See [External feed](#external-feed-omniscope-text) below.

## Genlock placeholders

Available in version **1.11.50+** for supported DeltaCast inputs.

| Tag                   | Description                                                                      |
| --------------------- | -------------------------------------------------------------------------------- |
| `%GENLOCK_STATUS%`    | Overall genlock state (`locked`, `unlocked`, `no reference`, or `not available`) |
| `%GENLOCK_LOCKED%`    | Simple lock state (`Yes`, `No`, or `N/A`)                                        |
| `%GENLOCK_SOURCE%`    | Active genlock source                                                            |
| `%GENLOCK_REFERENCE%` | Detected reference format                                                        |
| `%GENLOCK_OFFSET_PX%` | Genlock offset in pixels                                                         |

## SDI RX placeholders

Available in version **1.11.50+** for supported DeltaCast inputs.

| Tag                                | Description                                                                |
| ---------------------------------- | -------------------------------------------------------------------------- |
| `%SDI_RX_STATUS%`                  | Overall SDI RX health (`OK`, `errors`, `unlocked`, `no carrier`, or `N/A`) |
| `%SDI_RX_STATUS_HEX%`              | Raw SDI RX status flags in hexadecimal                                     |
| `%SDI_RX_LOCKED%`                  | Receiver lock state                                                        |
| `%SDI_RX_CARRIER%`                 | Carrier presence                                                           |
| `%SDI_RX_BAD_VIDEO_STANDARD%`      | Bad video-standard flag                                                    |
| `%SDI_RX_BAD_DATA%`                | Bad data flag                                                              |
| `%SDI_RX_OUT_OF_RANGE%`            | Out-of-range error flag                                                    |
| `%SDI_RX_CORRUPTED_SYNC%`          | Corrupted sync flag                                                        |
| `%SDI_RX_MISSING_SYNC%`            | Missing sync flag                                                          |
| `%SDI_RX_PARASITE_SYNC%`           | Parasite sync flag                                                         |
| `%SDI_RX_INVALID_LINE_NUMBER%`     | Invalid line-number flag                                                   |
| `%SDI_RX_CRC_EDH_ERROR%`           | CRC / EDH error flag                                                       |
| `%SDI_RX_CORRUPTED_ANC%`           | Corrupted ANC flag                                                         |
| `%SDI_RX_ANC_INTO_SWITCHING_LINE%` | ANC-in-switching-line flag                                                 |
| `%SDI_RX_CRC_LINE_ERRORS%`         | CRC line error count                                                       |

## External feed (`omniscope-text`)

Available from version **1.11.45**.

The External feed mode lets any command-line tool or script push text into a Text Display scope — for example the currently selected node in DaVinci Resolve, a render queue status, or the output of a monitoring script. OmniScope never runs commands itself; instead, you pipe your tool's output into the small `omniscope-text` helper, and the scope picks up the text live.

```bash
python -u resolve_current_node.py | omniscope-text --channel resolve-node
```

### Setting it up

1. In the Text Display scope settings, set **Source** to **External feed**.
2. Enter a **Channel** name (default: `default`). The settings panel shows the file path the scope is watching for that channel.
3. In a terminal, pipe your tool's output into `omniscope-text` with the same `--channel` name.

The scope updates as new text arrives, polling the channel at up to 60 Hz, so even rapid updates are visible immediately.

### Getting the `omniscope-text` command

* **macOS** — choose **Help → Install 'omniscope-text' command in PATH...** in OmniScope. This installs the helper to `/usr/local/bin/omniscope-text` so it works from any terminal. You can remove it later from the same menu. (The binary itself ships inside the app bundle at `NobeOmniScope.app/Contents/Resources/tools/omniscope-text`.)
* **Windows** — `omniscope-text.exe` is installed next to `NobeOmniScope.exe`. Run it from that folder, or add the folder to your `PATH` to use the short form from any terminal.

### Modes

* **Replace** (default) — the latest line replaces the previous text. Ideal for frequently updated single-line status, such as a Resolve node name.
* **Append** (`--append`) — keeps a rolling text buffer, trimmed to `--max-bytes`, for command output where history matters.

### Command reference

```bash
omniscope-text [--channel name] [--replace|--append] [--max-bytes n] [--rate hz] [--print-path]
```

| Option            | Default   | Description                                           |
| ----------------- | --------- | ----------------------------------------------------- |
| `--channel`, `-c` | `default` | Channel name the Text Display scope subscribes to     |
| `--replace`       | on        | Latest line replaces the previous text                |
| `--append`        | off       | Append lines to a rolling buffer instead of replacing |
| `--max-bytes`     | `65536`   | Maximum buffer size in append mode                    |
| `--rate`          | `60`      | Maximum publish rate in Hz (`0` = unlimited)          |
| `--print-path`    | —         | Print the channel file path and exit                  |

### Examples

```bash
# Show the current Resolve node name (single-line status)
python -u resolve_current_node.py | omniscope-text --channel resolve-node

# Show command output with history
ls *.txt | omniscope-text --channel txt-files --append
```

PowerShell (Windows):

```powershell
python -u .\resolve_current_node.py | .\omniscope-text.exe --channel resolve-node
```

{% hint style="info" %}
Channel text is exchanged through snapshot files in the system temp directory (`$TMPDIR/NobeOmniScope/text-feeds/` on macOS, `%TEMP%\NobeOmniScope\text-feeds\` on Windows). Writes are atomic, so the scope always shows complete snapshots. Use `omniscope-text --print-path --channel <name>` to see the exact file for a channel.
{% endhint %}


# QC

Quality Control


# Gamut Check

Gamut Check is a GPU based, real-time frame processing that detects any out-of-gamut values in the incoming (unmodified) signal:

<figure><img src="https://565437294-files.gitbook.io/~/files/v0/b/gitbook-x-prod.appspot.com/o/spaces%2F-MFqn5MuayPgQPMZ9pwf%2Fuploads%2Fgit-blob-27ead34534e80faccaea685e316050053379932e%2F2026-02_qc-gamut-check.jpg?alt=media" alt=""><figcaption><p>Gamut Check detecting out-of-gamut values</p></figcaption></figure>

Gamut check works together with Error Logger scope. In order to start logging the gamut errors, Gamut Check needs to be enabled.

{% hint style="info" %}
Please note that Gamut Check processes the unmodified input frame in real-time which might affect the performance of the application. Furthermore, if the machine is not fast enough and dropped frames occur - the end result of the gamut check can't be trusted simply because it missed some frames during the process.
{% endhint %}


# Setting Up OmniScope for Gamut Error Checking

Gamut errors occur when colors fall outside the acceptable range for broadcast or digital standards. This guide covers how to configure OmniScope for effective gamut error checking.

## Detecting Out-of-Gamut Signal

### Connecting with DeckLink / UltraStudio

To accurately detect out-of-gamut signals when monitoring through DeckLink or UltraStudio devices, set your signal to **Video range** and enable **Retain sub-black and super-white data** in the Video Monitoring settings:

<figure><img src="https://565437294-files.gitbook.io/~/files/v0/b/gitbook-x-prod.appspot.com/o/spaces%2F-MFqn5MuayPgQPMZ9pwf%2Fuploads%2Fgit-blob-7d13aa61c58aaec8e78e3fb471433e7641d2b1a2%2F2023-12_bmd_levels.jpg?alt=media" alt=""><figcaption><p>DaVinci Resolve Video Monitoring settings</p></figcaption></figure>

In OmniScope, verify that the video range settings for your I/O card are correctly configured:

<figure><img src="https://565437294-files.gitbook.io/~/files/v0/b/gitbook-x-prod.appspot.com/o/spaces%2F-MFqn5MuayPgQPMZ9pwf%2Fuploads%2Fgit-blob-429ae77844c6a1789bca6d7fd3821fd8883ab6a9%2F2026-02_decklink_signal_range.jpg?alt=media" alt=""><figcaption><p>OmniScope I/O card signal range settings</p></figcaption></figure>

For monitoring in **RGB format**, enable the **Expect video range** checkbox to capture all out-of-gamut values.

### Using OpenFX Plugin in Resolve

If you're connecting via the OpenFX plugin in DaVinci Resolve, confirm that you're using **Video range** signal in the Timeline settings of the OFX:

<figure><img src="https://565437294-files.gitbook.io/~/files/v0/b/gitbook-x-prod.appspot.com/o/spaces%2F-MFqn5MuayPgQPMZ9pwf%2Fuploads%2Fgit-blob-8268973f9b1da41f97f583f4c5e96ea54cee0fdb%2F2023-12_video_ofx.jpg?alt=media" alt=""><figcaption><p>OFX plugin timeline signal range</p></figcaption></figure>

The OpenFX plugin transmits sub-black and super-white signals to OmniScope, enabling comprehensive gamut checking.

## Configuring OmniScope

With the signal sources set up, disable automatic signal scaling to the full range so that adjustments made in Resolve are preserved:

<figure><img src="https://565437294-files.gitbook.io/~/files/v0/b/gitbook-x-prod.appspot.com/o/spaces%2F-MFqn5MuayPgQPMZ9pwf%2Fuploads%2Fgit-blob-fce85641ae7beb24ca8099d6e4c58b76bba18adf%2F2026-02_scale_signal_input_settings.jpg?alt=media" alt=""><figcaption><p>Disable automatic signal scaling</p></figcaption></figure>

Once disabled, out-of-range signals will be directly visible in the waveforms:

<figure><img src="https://565437294-files.gitbook.io/~/files/v0/b/gitbook-x-prod.appspot.com/o/spaces%2F-MFqn5MuayPgQPMZ9pwf%2Fuploads%2Fgit-blob-c61806ed9c869a3ed46410590d4600132fa64c58%2F2023-12_os_waveform_gamut.jpg?alt=media" alt=""><figcaption><p>Out-of-gamut values visible in waveforms</p></figcaption></figure>

Enable the **Gamut Check** in the QC menu and start the **Error Logger**. This creates a list of all gamut error events, which can be exported to a CSV file:

<figure><img src="https://565437294-files.gitbook.io/~/files/v0/b/gitbook-x-prod.appspot.com/o/spaces%2F-MFqn5MuayPgQPMZ9pwf%2Fuploads%2Fgit-blob-3267203916250b21de6769087cd1b47cb27b12ff%2F2023-12_os_logger.jpg?alt=media" alt=""><figcaption><p>QC Error Logger</p></figcaption></figure>

For more details on signal range configuration, see [Signal Range](/nobe-omniscope/sources/decklink-and-ultrastudio/signal-range).


# Luminosity Limit

Luminosity Limit QC monitors your video signal for pixels exceeding configurable brightness thresholds. This is essential for broadcast compliance and ensuring your content meets delivery specifications.

> **A note on terminology.** The name "Luminosity" is historical — the quantity actually being measured is **luma (Y')**, the weighted sum of the non-linear R'G'B' code values, not physical luminance. Luma is what broadcast spec documents mean when they say "signal level in IRE" or "percent", and it is the correct quantity for narrow-range legal checks (EBU R103, SMPTE RP 2077, ARIB TR-B32). For **absolute brightness in nits**, the signal is decoded through its inverse EOTF and the result is scene/display luminance (Y) — select the **Nits** scale for this mode.

## Overview

The Luminosity Limit tool checks every frame for:

* Pixels whose luma (or decoded nit value) exceeds a maximum threshold
* Pixels below a minimum threshold
* Both narrow-range ("legal") and full-range violations

This is particularly important for:

* Broadcast delivery compliance (e.g. 0–100 IRE luma window for SDR)
* HDR content validation (peak-nit and average-nit limits)
* Catching clipping before it reaches the deliverable

## Enabling the Tool

1. Open the **QC** panel (View > QC Panel or use the toolbar button)
2. Enable **Luminosity Limit** checkbox
3. Configure your threshold settings

## How It Works

The Luminosity Limit tool analyzes each frame and:

1. Computes luma (Y') per pixel — or decoded nits when the Nits scale is active
2. Compares values against your configured thresholds
3. Reports violations in real time
4. Logs errors to the QC Timeline for review

The scale choice changes the underlying measurement. In **IRE / Percent** mode, the tool works in luma space — no EOTF decoding is performed, and thresholds apply to gamma-encoded code values directly. In **Nits** mode, the signal is decoded through the active transfer function (PQ ST 2084, HLG, Rec. 709 BT.1886, etc.) and thresholds are compared against physical luminance.

## Settings

| Setting           | Description                             | Default |
| ----------------- | --------------------------------------- | ------- |
| Max Level         | Maximum allowed luminance (IRE or nits) | 100 IRE |
| Min Level         | Minimum allowed luminance               | 0 IRE   |
| Scale             | IRE, Percent, or Nits (for HDR)         | IRE     |
| Error Threshold   | Percentage of pixels to trigger error   | 0.1%    |
| Warning Threshold | Percentage of pixels to trigger warning | 0.01%   |

### Scale Options

| Scale   | Use Case                 | Range         | Measures                               |
| ------- | ------------------------ | ------------- | -------------------------------------- |
| IRE     | Standard broadcast (SDR) | 0–109 IRE     | Luma (Y')                              |
| Percent | General video work       | 0–100 %       | Luma (Y')                              |
| Nits    | HDR content              | 0–10 000 nits | Decoded luminance (Y) via inverse EOTF |

IRE is anchored to the legacy 0 = black / 100 = nominal white broadcast scale. "Percent" is numerically identical but avoids the IRE branding. **Nits** is the only absolute scale — both IRE and Percent are *relative* to the signal's nominal range.

## Reading the Results

### In the QC Panel

The QC panel shows real-time status:

* **Green**: All frames within limits
* **Yellow**: Warning threshold exceeded
* **Red**: Error threshold exceeded

Current statistics displayed:

* Maximum luma / nit value detected
* Percentage of pixels over limit
* Frame count with violations

### In the Timeline

Luminosity limit errors appear in the QC Timeline:

* **Yellow markers**: Warning-level violations
* **Red markers**: Error-level violations
* Threshold guide lines use the full scale range for the current signal depth, so their vertical position matches the actual detection threshold instead of shifting with the observed peak
* Click any marker to jump to that frame

### In Exports

When exporting QC reports (EDL/HTML):

* Each violation is logged with timecode
* Peak luma / nit value is recorded
* Percentage of over-limit pixels is included

## Use Cases

### Broadcast Delivery

Most broadcasters require video to stay within legal range:

1. Set Max Level to **100 IRE** (or per broadcaster specs)
2. Set Min Level to **0 IRE**
3. Set Error Threshold to match delivery specs (often 0%)

### HDR Mastering

For HDR content with specific peak brightness targets:

1. Switch Scale to **Nits**
2. Set Max Level to your target (e.g., 1000 nits for HDR10)
3. Use Warning Threshold to catch near-limit content

### Super-White Detection

To find super-white content (100-109 IRE range):

1. Set Max Level to **100 IRE**
2. Set Error Threshold very low (0.001%)
3. Review flagged frames individually

## Standards Reference

| Standard          | Max Level                               | Notes                                                                                  |
| ----------------- | --------------------------------------- | -------------------------------------------------------------------------------------- |
| **EBU R103**      | 100 % luma (5 % excursions up to 103 %) | European broadcast. Narrow-range signal; measurement is on the R103 pre-filtered luma. |
| **SMPTE RP 2077** | 100 IRE peak luma                       | US broadcast equivalent. Similar intent to R103.                                       |
| **ARIB TR-B32**   | 100 % luma                              | Japanese broadcast.                                                                    |
| **HDR10**         | 1 000 – 4 000 nits peak                 | Fixed PQ transfer function; mastering display peak is metadata.                        |
| **Dolby Vision**  | Up to 4 000 nits (Profile 5/7/8)        | PQ transfer; per-scene trim metadata (L1–L8) carried alongside.                        |
| **HLG**           | \~1 000 nits nominal peak               | Scene-referred OETF; display-dependent tone-mapping via a system gamma.                |

EBU R103 and SMPTE RP 2077 both operate on **luma**, not luminance — they are SDR specifications and deliberately do not decode through the EOTF. HDR10 and Dolby Vision operate on **absolute nits** after PQ decoding. HLG is unusual: the signal is scene-referred (OETF), so the same code values mean different nit levels depending on the display's peak luminance.

## Tips

* Use the Error Logger scope alongside Luminosity Limit for detailed tracking
* Set conservative Warning thresholds to catch issues before they become errors
* Different broadcasters have different specs - always verify requirements
* For HDR, consider using HDR Limit QC for more comprehensive checking

## Related QC Tools

* [HDR Limit](/nobe-omniscope/qc/hdr-limit) - Comprehensive HDR validation including MaxCLL/MaxFALL
* [Gamut Check](/nobe-omniscope/qc/gamut-check) - Color gamut compliance checking
* [Data Analyser](/nobe-omniscope/qc/data-analyser) - Detailed signal statistics
* [HDR Statistics](/nobe-omniscope/qc/hdr-statistics-maxfall-and-maxcll) - MaxCLL and MaxFALL measurement


# HDR Statistics (MaxFall & MaxCLL)

Nobe OmniScope can calculate **MaxCLL** (Maximum Content Light Level) and **MaxFALL** (Maximum Frame Average Light Level) HDR statistics in real time — the two numbers CTA-861.3 requires every HDR10 / HDR10+ / Dolby Vision deliverable to carry as static metadata.

* **MaxCLL** — the luminance of the single brightest pixel seen across the entire content, in nits
* **MaxFALL** — the luminance of the frame whose mean is highest across the entire content, in nits

The HDR Stats view shows both the current frame's values and the running global maxima. The application accumulates statistics as long as the input signal is live, and updates the graph frame by frame.

You can define the mastering level which will be displayed as a target line in the graph — e.g. the 1 000 nit or 4 000 nit peak of the mastering display actually used on the job.

You can also select the EOTF and color space — Gamma SDR, Gamma HDR (Rec. 2020, P3-DCI, or P3-D65), PQ ST 2084, or HLG. The signal is decoded through the selected inverse EOTF before luminance is measured, so picking the correct transfer function is essential: reading a PQ signal as if it were SDR gamma will produce meaningless numbers.

<figure><img src="https://565437294-files.gitbook.io/~/files/v0/b/gitbook-x-prod.appspot.com/o/spaces%2F-MFqn5MuayPgQPMZ9pwf%2Fuploads%2Fgit-blob-7bcfcb8b83b9294ca14b98f498002e0eee30a460%2F2026-02_qc-hdr-stats.jpg?alt=media" alt=""><figcaption><p>HDR Statistics showing MaxFALL and MaxCLL</p></figcaption></figure>

## Settings <a href="#settings" id="settings"></a>

{% hint style="info" %}
Available since version **1.11.38**.
{% endhint %}

### Measurement Mode

The industry never settled on a single way to collapse an RGB pixel to a single "luminance" number for MaxCLL / MaxFALL, so OmniScope offers both:

* **Max RGB (legacy)** — after decoding through the inverse EOTF, take `max(R, G, B)` as the pixel's light level. This is what Dolby's original analysis tool used and what most legacy HDR10 mastering tools still use. It is conservative: it reports the brightest channel, not the perceived brightness, so a pure saturated color reads higher than its perceptual equivalent.
* **Real luminance (CIE Y)** — after decoding through the inverse EOTF, compute the weighted sum `Y = 0.2627·R + 0.6780·G + 0.0593·B` (Rec. 2020 coefficients) to get true photometric luminance. This matches how human vision weights the three channels and produces lower readings for saturated colors than Max-RGB.

Check the delivery spec — different streamers accept different conventions, and the same content can pass or fail depending on which method was used to generate the metadata. Dolby Vision L1 analysis historically uses Max-RGB-derived values; some Netflix / Apple TV+ pipelines prefer CIE Y.

### Ignore Brightest Pixels

When enabled, a small percentage of the brightest pixels in each frame is excluded from the **MaxCLL** calculation. This helps stabilize the reading by removing hot-pixel outliers or specular highlights that can cause spikes.

Use the **Reject amount** slider to control how much of the bright tail to discard (from 0.001% to 1%, logarithmic scale). **MaxFALL** is not affected by this setting and always reflects the literal frame average.

<figure><img src="https://565437294-files.gitbook.io/~/files/v0/b/gitbook-x-prod.appspot.com/o/spaces%2F-MFqn5MuayPgQPMZ9pwf%2Fuploads%2Fgit-blob-37d8bdab8310ad1244ef43d69b936fa42e104606%2F2026-03_qc-hdr-stats-settings.jpg?alt=media" alt=""><figcaption><p>HDR Statistics settings — measurement mode and peak rejection</p></figcaption></figure>


# HDR Limit

HDR Limit QC provides comprehensive High Dynamic Range content validation, ensuring your HDR material meets delivery specifications for various HDR formats and platforms.

## Overview

The HDR Limit tool monitors:

* Peak luminance per frame, in absolute nits (for MaxCLL compliance)
* Frame-average luminance over the whole content (for MaxFALL compliance)
* Optionally, that the signal decodes cleanly through the active EOTF (no out-of-range PQ / HLG code values)

This is essential for:

* **HDR10** and **HDR10+** mastering (static and dynamic PQ metadata)
* **Dolby Vision** deliverables (PQ base layer plus per-scene L1–L8 metadata)
* **HLG** broadcast content (ARIB STD-B67 scene-referred transfer)
* Streaming platform ingest requirements (Netflix / Disney+ / Apple TV+ / Amazon / YouTube)

## Enabling the Tool

1. Open the **QC** panel (View > QC Panel or use the toolbar button)
2. Enable **HDR Limit** checkbox
3. Select your target HDR format
4. Configure threshold settings

## How It Works

HDR Limit performs per-frame analysis:

1. Decodes the signal through the **inverse EOTF** (SMPTE ST 2084 for PQ, ARIB STD-B67 for HLG) to obtain per-pixel **display luminance** in candelas per square meter (nits). HLG additionally applies the system gamma tied to a chosen nominal peak (default 1 000 nits).
2. Computes **per-pixel luminance (Y)** — the scalar quantity metadata specs reference for MaxCLL / MaxFALL. Two methods exist in the industry:
   * **Max-RGB** — take the maximum of the three linear channels per pixel. Used by Dolby's original Dolby Vision analysis and by most HDR10 mastering tools.
   * **CIE Y** — compute a properly weighted sum of the linear R, G, B values (the active color space's Y coefficients). Closer to perceptual brightness. Check your target spec — MaxCLL/MaxFALL as CTA-861.3 defines them reference a luminance of a pixel, and different tools interpret this slightly differently.
3. Tracks the **per-frame maximum** (for MaxCLL) and the **frame average** (for MaxFALL).
4. Compares against format-specific limits.
5. Logs violations to the QC Timeline.

## Settings

| Setting            | Description                       | Default |
| ------------------ | --------------------------------- | ------- |
| HDR Format         | Target HDR specification          | HDR10   |
| Max Peak (nits)    | Maximum peak brightness allowed   | 1000    |
| Max Average (nits) | Maximum frame average (MaxFALL)   | 400     |
| Error Threshold    | Pixel percentage to trigger error | 0.1%    |

### HDR Format Presets

| Preset                | Max Peak     | Max Average  | Notes                                                                                                                                                                             |
| --------------------- | ------------ | ------------ | --------------------------------------------------------------------------------------------------------------------------------------------------------------------------------- |
| **HDR10 (1000 nits)** | 1 000        | 400          | Most common HDR10 mastering-display peak; matches Netflix/Amazon reference.                                                                                                       |
| **HDR10 (4000 nits)** | 4 000        | 1 000        | "Premium" HDR10 — Sony X300 / Dolby PRM-4200 class mastering.                                                                                                                     |
| **Dolby Vision**      | 4 000        | 1 000        | Dolby Vision carries a **mastering display metadata tag** (e.g. `Mastering Display 1000,0.005` or `4000,0.005`). Targets depend on the mastering display actually used.           |
| **HLG**               | 1 000        | 400          | HLG is **scene-referred**: the code values themselves don't commit to a peak-nit target, but the display's system gamma maps to a nominal peak (usually 1 000 nits at reference). |
| **Custom**            | User-defined | User-defined | Manual settings                                                                                                                                                                   |

> **HDR10 vs HDR10+ vs Dolby Vision.** All three use PQ as their base transfer function and Rec. 2020 as their container. The difference is the metadata layer: HDR10 ships a single **static** pair of MaxCLL/MaxFALL values per title; HDR10+ adds **dynamic** per-frame tone-mapping metadata (SMPTE ST 2094-40); Dolby Vision adds its own dynamic per-shot L1–L8 metadata (SMPTE ST 2094-10 / profile-specific). Dolby Vision's L1 metadata — min, avg, max luminance per shot — is exactly what HDR Limit QC computes.

## Reading the Results

### In the QC Panel

Real-time display shows:

* **Current Peak**: Maximum nits in current frame
* **Max Peak**: Highest peak seen in session
* **Current Average**: Frame average luminance
* **MaxFALL**: Running content average
* **Status**: Pass/Warning/Error indicator

### In the Timeline

HDR limit violations appear as:

* **Yellow markers**: Approaching limits (warning)
* **Red markers**: Exceeding limits (error)
* Hover for details including peak nits value

### In Exports

QC reports include:

* Timecode of each violation
* Peak brightness value
* Whether MaxCLL or MaxFALL was exceeded
* Frame-by-frame statistics

## Use Cases

### HDR10 Mastering

Validate content for HDR10 delivery:

1. Select **HDR10 (1000 nits)** preset
2. Enable MaxFALL tracking
3. Run full content playback
4. Review any flagged frames

### Streaming Platform QC

Different platforms have different requirements:

| Platform  | Typical Max Peak | Notes                  |
| --------- | ---------------- | ---------------------- |
| Netflix   | 1000-4000 nits   | Content dependent      |
| Amazon    | 1000-4000 nits   | HDR10/DV supported     |
| Apple TV+ | Up to 4000 nits  | Dolby Vision preferred |
| YouTube   | 1000 nits        | HDR10 support          |

### Broadcast HDR (HLG)

For HLG broadcast delivery:

1. Select **HLG** preset
2. Set Max Peak to broadcaster requirement
3. Enable average brightness monitoring
4. Verify against delivery specs

## Understanding HDR Metrics

These are defined in **CTA-861.3** as HDR static metadata type 1, carried in the SEI / mastering-display-metadata fields of the stream.

### MaxCLL (Maximum Content Light Level)

The luminance value of the **single brightest pixel** in the whole content, in nits. Think of it as "the peak of peaks". HDR Limit tracks this across the session and reports the highest value encountered. MaxCLL feeds the downstream tone-mapper: a TV with a 600-nit panel seeing MaxCLL = 1 000 will compress highlights from 600–1 000 down to the panel's peak without crushing midtones.

### MaxFALL (Maximum Frame Average Light Level)

The **frame whose average linear luminance is highest**, reported in nits. "Average" here is computed over the active picture area. MaxFALL is the knob that tells a consumer display how aggressively to defend itself against sustained full-field brightness (to protect the panel, especially on OLEDs that dim the whole screen under heavy load). A low MaxCLL with a high MaxFALL is a bright, uniform scene (a snowfield). A high MaxCLL with a low MaxFALL is a dark scene with one hot specular highlight (a lightbulb at night).

### Why Both Matter

* Consumer displays use MaxCLL/MaxFALL to drive their tone-mapping curves
* Wrong values cause visible errors — crushed highlights (MaxCLL too low), panel dimming kicking in at the wrong level (MaxFALL wrong)
* Streaming platforms require the static metadata to be truthful; incorrect tags fail ingest QC
* Dolby Vision's per-scene **L1 metadata** (min / avg / max) plays the same role at a finer granularity — 24 frames instead of "the whole title"

## Standards Reference

| Standard         | Transfer     | Metadata                          | Typical MaxCLL                   | Typical MaxFALL  |
| ---------------- | ------------ | --------------------------------- | -------------------------------- | ---------------- |
| **HDR10**        | PQ (ST 2084) | CTA-861.3 static                  | 1 000 – 4 000 nits               | 400 – 1 000 nits |
| **HDR10+**       | PQ (ST 2084) | ST 2094-40 dynamic                | Per-scene                        | Per-scene        |
| **Dolby Vision** | PQ (ST 2084) | Dolby L1–L8 (ST 2094-10) per-shot | Up to 4 000 nits (Profile 5/7/8) | Per-shot         |
| **HLG**          | ARIB STD-B67 | No static tone metadata           | \~1 000 nits at reference        | \~400 nits       |

All four use **Rec. 2020** as the color container. Chromaticity rarely exceeds **P3-D65** in practice because current mastering displays don't cover more than \~99 % of P3.

## Tips

* Always verify delivery specs with your distributor
* Use HDR Statistics scope for detailed MaxCLL/MaxFALL measurement
* Test problematic frames in the False Color scope with HDR preset
* Consider headroom - staying below 90% of limits is good practice

## Related QC Tools

* [Luminosity Limit](/nobe-omniscope/qc/luminosity-limit) - General brightness limit checking
* [HDR Statistics](/nobe-omniscope/qc/hdr-statistics-maxfall-and-maxcll) - MaxCLL/MaxFALL measurement
* [Gamut Check](/nobe-omniscope/qc/gamut-check) - Color gamut compliance
* [Data Analyser](/nobe-omniscope/qc/data-analyser) - Detailed signal analysis


# Blanking Detection

Blanking Detection finds black borders around active picture content (letterboxing and pillarboxing) and can also handle slightly rotated content.

<figure><img src="https://565437294-files.gitbook.io/~/files/v0/b/gitbook-x-prod.appspot.com/o/spaces%2F-MFqn5MuayPgQPMZ9pwf%2Fuploads%2Fgit-blob-7769bbb0bc7509110a33abd2fbd9cafaf06d6d70%2F2026-02_qc-blanking.jpg?alt=media" alt=""><figcaption><p>Blanking Detection highlighting detected borders</p></figcaption></figure>

## What It Detects

* Top, bottom, left, and right blanking depth
* Rotated blanking patterns (for example, corner triangles)
* Optional overlay warnings directly in the viewer

## Where to Enable It

1. Open the **QC** panel.
2. Enable **Blanking Detection**.
3. Adjust margins and thresholds as needed.

## Settings

### Detection Margins

Set how far from each edge OmniScope should search for blanking.

### Threshold Mode

| Mode   | Typical Use             |
| ------ | ----------------------- |
| Auto   | Most workflows          |
| Full   | Full-range signals      |
| Video  | Video-range signals     |
| Custom | Manual threshold tuning |

In **Custom** mode, set R/G/B thresholds manually.

### Warning Color

Set the overlay color used when blanking is detected.

## Results and Feedback

* Overlay is drawn in the source viewer when blanking is detected.
* QC status shows active detections in real time.
* Rotation information is shown when rotated blanking is detected.
* Events are available in QC timeline workflows.

## Aspect Ratio Awareness

Blanking detection runs after input aspect-ratio handling, so letterboxed content inside another container can still be detected correctly.

## Troubleshooting Tips

* If dark scenes trigger false positives, tighten margins and/or raise thresholds.
* If rotated content is under-detected, widen margins slightly.
* If overlays are hard to see, switch to a higher-contrast warning color.

## Demo

{% embed url="<https://www.youtube.com/watch?v=78Z_rOgcioA>" %}


# Data Analyser

Nobe OmniScope features Data Analyser which can be opened directly from the source viewer (context menu) and gives you raw data view in any bit-depth format that is supported in OmniScope:

1. 8-bit
2. 10-bit
3. 12-bit
4. 32-bit floating point

For non-Nits formats, **Analyser readout range** can display **Source values**, **Decoded RGB**, **Video range**, or **Full range**. This changes the displayed numbers only; it does not change source decoding or scope processing. Source values preserve the reconstructed native RGB or YCbCr domain when **Input Source** is selected.

See [Source Signal → Data Analyser](/nobe-omniscope/scopes/source-signal#data-analyser) for source-stage, range, and display options.

![](https://565437294-files.gitbook.io/~/files/v0/b/gitbook-legacy-files/o/assets%2F-MFqn5MuayPgQPMZ9pwf%2F-M_5DpEc8MoKFufbaUAV%2F-M_5DuAKMQeRtSNQy3b0%2Fos_data_analyser.gif?alt=media\&token=a30a5808-b31f-4b3c-ba95-9c2e824f810f)


# QC Timeline

QC Timeline feature

QC Timeline V2 (available since 1.11.25) replaces the earlier timeline with improved rendering and clarity. V2 keeps the same track-based workflow but is faster to render and clearer at high density.

OmniScope features a very useful QC tool called QC Timeline. It can be toggled in the QC top menu and allows you to see all the QC events as well as audio waveform, HDR stats, thumbnails and many more.

<figure><img src="https://565437294-files.gitbook.io/~/files/v0/b/gitbook-x-prod.appspot.com/o/spaces%2F-MFqn5MuayPgQPMZ9pwf%2Fuploads%2Fgit-blob-f497d251b084d8a0d36726be1f779550316245da%2F2026-02_qc-timeline.jpg?alt=media" alt=""><figcaption><p>QC Timeline with multiple tracks</p></figcaption></figure>

The timeline is built in realtime based on incoming frames and uses timecode to reference events. This means you can monitor your SDI signal as it comes in and will follow your playhead in real-time while you move around your timeline.

Timeline can be configured to display up to 8 tracks:

1. Timecode,
2. HDR Stats,
3. Blanking,
4. HDR Gamut,
5. Audio Silence,
6. Audio Waveform,
7. Audio Loudness,
8. Thumbnails.

Each track can be toggled on and off in the right click context menu:

<figure><img src="https://565437294-files.gitbook.io/~/files/v0/b/gitbook-x-prod.appspot.com/o/spaces%2F-MFqn5MuayPgQPMZ9pwf%2Fuploads%2Fgit-blob-c8aea510928a5affd68df777a0dcd96aac2ac989%2F2026-02_qc-timeline-menu.jpg?alt=media" alt=""><figcaption><p>QC Timeline context menu with track toggles</p></figcaption></figure>

You can also change the size of each track by dragging & dropping the top/bottom edges of the tracks. You can also re-arrange the tracks by dragging & dropping the track headers on the left side.

## Using Free Run for Quick QC Scans

When working with video files, enable **Free run** mode in the source's **Settings** tab to process frames as fast as possible — without waiting for real-time playback. The QC Timeline will be built at accelerated speed, allowing you to scan an entire file in a fraction of the normal playback time. See [Video File — Free Run Mode](/nobe-omniscope/sources/video-file#free-run-mode) for setup details.

The context menu allows you to reset the timeline (start building it from scratch), clear the bookmarks (you can add them through streamdeck action or cmd/ctr+B key shortcut), import and export the timeline to file (for further quick access) as well as [exporting the QC events as markers via EDL](/nobe-omniscope/qc/qc-edl-export).

In OmniScope 1.11.54 and later, the context menu also includes **Send to Secondary Window**. Each input's timeline can be placed independently, and its assigned window is saved in layouts.

Also in 1.11.54 and later, thumbnail history remains visible when file playback loops or the playhead moves backward. Resetting the timeline starts a clean thumbnail history. Luminance-track Min/Max tooltips identify their values as **code values**, not nits; tracks that measure actual HDR luminance continue to use nits.


# QC EDL Export

Exporting QC markers to EDL file

It is now possible to export all the QC events from the timeline view to EDL file which then can be imported in DaVinci Resolve.

To export an EDL simply right-click in the timeline area and select "Export EDL":

<figure><img src="https://565437294-files.gitbook.io/~/files/v0/b/gitbook-x-prod.appspot.com/o/spaces%2F-MFqn5MuayPgQPMZ9pwf%2Fuploads%2Fgit-blob-576e34066aa66393d4ab12fe13da0997e8c9458d%2F2026-02_qc-timeline-export-edl.jpg?alt=media" alt=""><figcaption><p>EDL Export in OmniScope</p></figcaption></figure>

Now, to import the QC events as markers in DaVinci Resolve, navigate to the Media Pool, right click your timeline where you want the markers to be imported and select:

Timelines -> Import -> Timeline Markers from EDL...

<figure><img src="https://565437294-files.gitbook.io/~/files/v0/b/gitbook-x-prod.appspot.com/o/spaces%2F-MFqn5MuayPgQPMZ9pwf%2Fuploads%2FYDT8hSRkC8S7ewbhSNpv%2FCleanShot%202023-10-05%20at%2013.39.47%402x.png?alt=media&amp;token=db70a02c-809a-427e-a06e-301587d51c02" alt=""><figcaption><p>EDL Markers import in Resolve</p></figcaption></figure>

After that you should be able to see the markers in the timecode track and marker descriptions in your viewer.

## Troubleshooting

If your markers are not importer properly, please make sure your starting timecode is the same in both OmniScope and Resolve. To reset timeline timecode in Resolve, navigate to:

Preferences -> User -> Editing

And adjust "Start timecode":

<figure><img src="https://565437294-files.gitbook.io/~/files/v0/b/gitbook-x-prod.appspot.com/o/spaces%2F-MFqn5MuayPgQPMZ9pwf%2Fuploads%2FzyYp1TxB0XyZ4uvSYx3p%2FCleanShot%202023-10-05%20at%2013.42.41%402x.png?alt=media&amp;token=82ca079b-248f-49dc-9a36-7f42713b4f6c" alt=""><figcaption></figcaption></figure>

{% hint style="info" %}
Please note that this feature is available only in the Pro version of the software.
{% endhint %}


# Live Pack add-on

Extend OmniScope Pro for on-set and live broadcast workflows in OB trucks, studios and flypacks.

## Live Pack for Nobe OmniScope Pro

> **Real-time workflows. Multi-camera monitoring. Seamless integration.**\
> A powerful add-on for **Nobe OmniScope Pro**, built for DITs, live event engineers, and multi-camera production workflows.

***

### 🎬 What is Live Pack?

Live Pack transforms **OmniScope Pro** into a central monitoring and analysis hub—whether you’re on a mobile DIT cart or in a multi-cam control room.\
It enhances OmniScope with **real-time production features** including:

1. **Pomfort Livegrade Integration**
   * Zero-copy, near zero-latency direct GPU signal sharing
   * Monitor Livegrade signals in OmniScope without SDI loopbacks or I/O hardware
2. **SDI Output**
   * Low-latency, reference-grade monitoring via DeckLink / UltraStudio
3. **Multi-Input Monitoring**
   * Flexible composite layouts for live shows
4. **Record to File**
   * Capture H.264 or ProRes straight to disk
5. **Composite Views & Snapshots**
   * Compare sources and freeze frames instantly
6. **Focus Peaking**
   * Real-time sharpness verification
7. **Loudness Meter**
   * EBU/ATSC compliance in live audio

> *“It’s hands down the most powerful and customizable video scope available.”*\
> — **Sean Sweeney**, Digital Imaging Technician (DIT)

***

### 🚀 Who is it for?

* **DITs on set** needing fast QC and color-accurate monitoring
* **Live broadcast technicians and camera shaders** monitoring feeds in OB trucks, studios and flypacks
* **Colorists** working in real-time production pipelines
* **Multi-cam directors & shader operators** requiring flexible layouts

***

For SDI setup, camera matching, reference snapshots and pre-show checks, start with [OB and live broadcast monitoring](/nobe-omniscope/outside-broadcast).

### 💡 Why Live Pack?

Because real-time environments demand speed, precision, and flexibility.\
Live Pack eliminates extra gear, reduces latency, and puts all essential tools directly inside **Nobe OmniScope Pro**.

***

### 💵 Pricing

* **One-time purchase** - available in EUR and USD
* **Add-on**: purchase Live Pack as an add-on to your existing OmniScope Pro license
* **Bundle**: purchase OmniScope Pro + Live Pack together (best value for new customers)
* For personal OmniScope Pro licenses, the Live Pack base price covers the default 2-seat license
* Extra personal seats add half of the current Live Pack base price per seat
* For Studio / per-room OmniScope Pro licenses, Live Pack is priced at the full current Live Pack price per licensed room
* Live Pack is a one-time add-on purchase
* Live Pack does **not** create a separate annual renewal fee or subscription
* Checkout uses current Paddle pricing, including any active discount

If you have a legacy 3-seat OmniScope Pro license, Live Pack pricing follows that license configuration. If you only use 2 personal machines and would prefer a 2-seat license instead, please [contact support](https://timeinpixels.com/contact). For Studio / per-room licenses, pricing follows the number of licensed rooms.

> Check current pricing at [timeinpixels.com/store](https://timeinpixels.com/store)


# Livegrade integration

{% hint style="info" %}
**Requirement** — LiveGrade integration requires **Pomfort LiveGrade 7.1** or later.
{% endhint %}

Live Pack includes native integration with **Pomfort Livegrade**, enabling you to monitor color-graded feeds directly—without the need for SDI loopbacks or secondary routing. This software-only approach removes latency and simplifies signal pipelines, letting you view exactly what’s being adjusted in real-time.

<figure><img src="https://565437294-files.gitbook.io/~/files/v0/b/gitbook-x-prod.appspot.com/o/spaces%2F-MFqn5MuayPgQPMZ9pwf%2Fuploads%2Fgit-blob-da4a27946cf85ad8653bc31d8d09adf21d09d6fe%2F2026-02_livegrade-integration.png?alt=media" alt=""><figcaption><p>Livegrade with 7 OmniScope instances</p></figcaption></figure>

> “Previously, I had to route a separate SDI signal from Livegrade into OmniScope. Now I can monitor it in software with no extra gear and zero delay.”
>
> — Sean Sweeney, DIT

{% embed url="<https://youtu.be/uvuVAUqnWjY>" %}

## Connecting Livegrade to OmniScope

1. Open both **Livegrade** and **OmniScope** on the same machine.
2. In Livegrade, open the **Slot Manager** and switch to the **Output** tab. Add one or more output slots with the device set to **OmniScope**. Each slot appears as a separate output (e.g. Out A, Out B). The **Connection State** should show **Connected** when OmniScope is running.

<figure><img src="https://565437294-files.gitbook.io/~/files/v0/b/gitbook-x-prod.appspot.com/o/spaces%2F-MFqn5MuayPgQPMZ9pwf%2Fuploads%2Fgit-blob-d241e87a30576a72befb6dabc020addebd90373e%2F2026-03_livegrade-outputs.jpg?alt=media" alt=""><figcaption><p>Livegrade Slot Manager with two OmniScope outputs connected</p></figcaption></figure>

3. In OmniScope, open the source picker. The Livegrade outputs are automatically detected and listed under the **GPU Share Source** section (e.g. "Livegrade: Out A", "Livegrade: Out B"). OmniScope keeps one picker entry per Livegrade output slot and refreshes that entry if Livegrade re-announces the slot after a restart or output toggle. Select an entry to start monitoring.

<figure><img src="https://565437294-files.gitbook.io/~/files/v0/b/gitbook-x-prod.appspot.com/o/spaces%2F-MFqn5MuayPgQPMZ9pwf%2Fuploads%2Fgit-blob-69fb2daf60caaf456399bb136b5521f7e73bcf72%2F2026-03_livegrade-omniscope-sources.jpg?alt=media" alt=""><figcaption><p>OmniScope source picker showing auto-detected Livegrade outputs</p></figcaption></figure>

## Workflow tips

### Monitoring the original (ungraded) image

Use Livegrade's **"Force Display Mode to"** feature on an OmniScope output to send the original camera image to OmniScope for analysis, while continuing to view graded images on your client monitors. This is useful when you need accurate exposure or color-balance readings from the unprocessed signal.

### Removing HUD overlays from analysis

If your camera feed includes burned-in metadata or HUD elements, apply a **crop filter** on the Livegrade output before it reaches OmniScope. This prevents on-screen overlays from affecting waveform, vectorscope, or histogram readings.

### Additional output streams

The standard integration provides **2 output streams** from Livegrade to OmniScope. If your workflow requires more streams, extended configurations are available — contact <feedback@pomfort.com> to discuss your use case.

***

{% hint style="info" %}
Pomfort also maintains their own documentation for this integration on their knowledge base: [Pomfort KB — OmniScope integration](https://kb.pomfort.com/livegrade/omniscope/)
{% endhint %}


# SDI Out

Route video output from OmniScope to external SDI monitors using **Blackmagic Design DeckLink** or **UltraStudio** devices. Supports source pass-through and full scope view output modes, with 8-bit, 10-bit, and 16-bit pixel formats.

For full details, settings, and supported formats, see [SDI Output (DeckLink / UltraStudio)](/nobe-omniscope/outputs/sdi-output).

<figure><img src="https://565437294-files.gitbook.io/~/files/v0/b/gitbook-x-prod.appspot.com/o/spaces%2F-MFqn5MuayPgQPMZ9pwf%2Fuploads%2Fgit-blob-d2d4cb4d6f6ea15d2d04d646fa91458eae3b3ab5%2F2026-02_sdi_out.jpg?alt=media" alt=""><figcaption><p>SDI Output settings</p></figcaption></figure>


# Record to file

Capture live video feeds **directly to disk** using either **H.264 (macOS/Windows)**, **HEVC (macOS/Windows)** or **ProRes (macOS)** codecs. The intuitive interface supports **manual recording** or **trigger-based options**, including keyboard shortcuts or **Stream Deck integration**.

> Use case: Archiving signal for live productions or recording unexpected color issues.

For each input source you can configure video file recording separately — codec, resolution, and custom filename template.

From **1.11.45+**, these recording settings are remembered for each input source and no longer reset after restarting OmniScope or reconnecting the source.

![Configure video file capture for each input separately.](https://565437294-files.gitbook.io/~/files/v0/b/gitbook-x-prod.appspot.com/o/spaces%2F-MFqn5MuayPgQPMZ9pwf%2Fuploads%2F1rjOho8CqrhozopnzHYo%2F2025-07-29_livepack_record_01.png?alt=media\&token=60a3e17d-2d22-4a4e-baf1-3cb226485391)

Configure video file capture for each input separately.

If recording fails to start (e.g. due to a missing codec, full disk, or an inaccessible folder), OmniScope now displays a clear error dialog describing the cause. Check the message and verify the recording folder path and available disk space.

You can quickly toggle the recording in the Input Strip context menu or from keyboard shortcut / Stream Deck action:

![Context menu allows for a quick capture toggle](https://565437294-files.gitbook.io/~/files/v0/b/gitbook-x-prod.appspot.com/o/spaces%2F-MFqn5MuayPgQPMZ9pwf%2Fuploads%2FhfNwg0R8mj1kytgjaXcv%2F2025-07-29_livepack_record_02.png?alt=media\&token=859d538b-5f30-4e10-8ba9-0d17da24aada)

Context menu allows for a quick capture toggle

When recording is active, a red dot appears in the input strip:

<figure><img src="https://565437294-files.gitbook.io/~/files/v0/b/gitbook-x-prod.appspot.com/o/spaces%2F-MFqn5MuayPgQPMZ9pwf%2Fuploads%2FAlobZLCciPUpgP4l6jh2%2F2025-07-29_livepack_record_03.png?alt=media&amp;token=55c9fa14-af64-4975-af0a-a74c730eebe3" alt=""><figcaption></figcaption></figure>

## Recording Folder

By default, recorded clips are saved alongside snapshots in the active snapshot folder. You can set a dedicated recording folder in **Input Settings > Codec & output**:

* **Browse folder…** — select a custom directory for all recorded clips
* **Use snapshot folder** — reset to saving clips next to snapshots (default)

The recording folder applies to all input slots. If the selected folder doesn't exist, it is created automatically when recording starts. (1.11.34+)

## Multi-Slot Recording

You can record from multiple input slots simultaneously. Each slot produces its own clip file with a `_s{slot}` suffix to distinguish them:

| Input  | Example filename                   |
| ------ | ---------------------------------- |
| Slot 0 | `capture_2026-03-15_143022_s0.mp4` |
| Slot 1 | `capture_2026-03-15_143022_s1.mp4` |
| Slot 2 | `capture_2026-03-15_143022_s2.mp4` |

Start and stop recording independently for each slot using the context menu, keyboard shortcuts, or Stream Deck actions. (1.11.34+)

## Filename Template

Customize the clip filename pattern using tokens. The same tokens available for [snapshot filename templates](/nobe-omniscope/features/snapshots#filename-templates) can be used, with the most common being:

| Token          | Description      | Example       |
| -------------- | ---------------- | ------------- |
| `%DATE%`       | Current date     | `2026-03-15`  |
| `%TIME%`       | Current time     | `143022`      |
| `%INPUT_SLOT%` | Input slot index | `0`, `1`, `2` |

The default template is `capture_%DATE%_%TIME%_s%INPUT_SLOT%`, producing files like `capture_2026-03-15_143022_s0.mp4`.

Your chosen filename template is also persisted per input source. (1.11.45+)

## Codecs

| Codec         | Platform       | Notes                              |
| ------------- | -------------- | ---------------------------------- |
| H.264         | macOS, Windows | Default, widely compatible         |
| HEVC          | macOS, Windows | Better compression at same quality |
| ProRes 422    | macOS only     | High quality, larger files         |
| ProRes 422 LT | macOS only     | Lighter variant of ProRes 422      |

## Resolution

Recordings can be captured at **1280×720** or **1920×1080**. The source signal is scaled to the selected resolution during recording.


# Composite Input

Aggregate multiple feeds into a single composite view using the **Composite Source module**. Choose from preconfigured layouts for **2, 4, 6, or 8 sources**, and assign video sources to each tile. Each grid cell can also have its own editable label.

> Powerful for directors, shader operators, or colorists working on multi-cam shows.

![](https://565437294-files.gitbook.io/~/files/v0/b/gitbook-x-prod.appspot.com/o/spaces%2F-MFqn5MuayPgQPMZ9pwf%2Fuploads%2Fr5LJ5VNVDTodvZXJ6Evw%2F2025-07-29_livepack_comp_01.png?alt=media\&token=2a8b6f1e-033f-400c-98b6-a0c1ab71d1d7)

Drag and drop source inputs into the grid, then rename each cell if you want custom source labels for operators or talent:

![](https://565437294-files.gitbook.io/~/files/v0/b/gitbook-x-prod.appspot.com/o/spaces%2F-MFqn5MuayPgQPMZ9pwf%2Fuploads%2FLVSBOGYVKbsy7GoZGUYA%2F2025-07-29_livepack_comp_02.png?alt=media\&token=208006ce-2aea-4da7-850a-506dc1929ce8)

If needed, enable **Show labels in Original Scope** to overlay those labels on the composite preview in Original Scope without changing the source image itself. Use the **Original Scope label size** slider (50 %–200 %) to adjust the overlay text size.

Flexible configuration for dynamic layouts:

![Flexible configuration options](https://565437294-files.gitbook.io/~/files/v0/b/gitbook-x-prod.appspot.com/o/spaces%2F-MFqn5MuayPgQPMZ9pwf%2Fuploads%2FHqZBmAJKwGAs9mto4LrF%2F2025-07-29_livepack_comp_03.png?alt=media\&token=e042f434-9b25-43d3-ab1e-9141807e93e7)

Flexible configuration options

Available layout presets include:

* **2 sources**: **Top / Bottom** or **Side by side**
* **4 sources**: **2x2** (Quad view)
* **6 or 8 sources**: wider multi-cam grids

For two-source comparisons, use **2-source layout** in Composite Settings to switch between a vertical stack and a horizontal side-by-side split.

<figure><img src="https://565437294-files.gitbook.io/~/files/v0/b/gitbook-x-prod.appspot.com/o/spaces%2F-MFqn5MuayPgQPMZ9pwf%2Fuploads%2FXp6boW3GvTtHZBbQsQs3%2F2025-07-29_livepack_comp_04.png?alt=media&amp;token=716b35cf-44d2-49a6-8dd6-7142a55d3fc7" alt=""><figcaption></figcaption></figure>


# Snapshot as Source

Any **snapshot** taken in OmniScope can be instantly promoted to a **live source** for use in scope comparisons or overlays. This is ideal for camera matching, before/after comparisons, or using reference frames during production.

> Allows side-by-side evaluation of live signal vs. static references—without switching applications.


# Auto-Snapshot

Enable **automatic snapshotting** from any live feed on a **custom interval**—from minutes down to milliseconds. This is invaluable for continuous signal capture, temporal color comparison, or set documentation.

> Use case: Live camera matching, documenting set looks, and verifying visual consistency.

![Configure auto-snapshots interval](https://565437294-files.gitbook.io/~/files/v0/b/gitbook-x-prod.appspot.com/o/spaces%2F-MFqn5MuayPgQPMZ9pwf%2Fuploads%2FDXJ7wQcy0RcradaVA0YH%2F2025-07-29_livepack_autosnap_01.png?alt=media\&token=a486d5d7-79f7-49a2-a4df-68532001cfc0)

Configure auto-snapshots interval


# Focus Peaking

###

**Focus Peaking** modes help verify sharpness and edge clarity in real-time. Available modes include:

* **Enhanced Edges** – Highlights outlines for fine focus validation
* **Normal** – Traditional peaking for fast on-set feedback

You can adjust the threshold and peaking color for maximum visual clarity.

> “Pixel-level control makes it easier to judge focus during live setups or single-camera interviews.”

<figure><img src="https://565437294-files.gitbook.io/~/files/v0/b/gitbook-x-prod.appspot.com/o/spaces%2F-MFqn5MuayPgQPMZ9pwf%2Fuploads%2FrNobYzPaYMprCrecVyh3%2F2025-07-29_livepack_focuspeek_01.png?alt=media&amp;token=6fae9dd8-c7f2-4bb1-bf70-d9a83cf18341" alt=""><figcaption></figcaption></figure>

<figure><img src="https://565437294-files.gitbook.io/~/files/v0/b/gitbook-x-prod.appspot.com/o/spaces%2F-MFqn5MuayPgQPMZ9pwf%2Fuploads%2FKTQLEgDhzwDVkGHj6P5l%2F2025-07-29_livepack_focuspeek_02.png?alt=media&amp;token=4a2f7c87-a4f7-44ae-b8f7-897d55da3bf3" alt=""><figcaption></figcaption></figure>


# Loudness Meter

Ensure audio compliance with **Momentary**, **Short-Term**, and **Integrated** loudness metering (M/S/I). The loudness meter displays all measurements in **real time** with color-coded bar graphs.

> Critical for live event engineers needing EBU or ATSC loudness compliance.

<figure><img src="https://565437294-files.gitbook.io/~/files/v0/b/gitbook-x-prod.appspot.com/o/spaces%2F-MFqn5MuayPgQPMZ9pwf%2Fuploads%2F6uO6II6N3hNyQJFY5Czm%2F2025-07-29_livepack_loudness_01.png?alt=media&amp;token=7720c96f-621b-481e-8ed5-0e3d8513c5a0" alt=""><figcaption></figcaption></figure>


# Live Pack Setup

How to install and set up Live Pack

To get started with Live Pack, download the latest official build from the downloads page:

<https://timeinpixels.com/downloads/>

### Check for updates

After installing, you can check for the latest version by going to **Help / Check for Updates**.

### Refresh the license

The last step is to refresh the license so that the Live Pack add-on is enabled in the application:

<figure><img src="https://565437294-files.gitbook.io/~/files/v0/b/gitbook-x-prod.appspot.com/o/spaces%2F-MFqn5MuayPgQPMZ9pwf%2Fuploads%2Fgit-blob-99e88a5346c0d9f92def6ac14e8085c407974bfe%2FCleanShot%202026-03-04%20at%2000.45.40%402x.jpg?alt=media" alt=""><figcaption></figcaption></figure>

After application restart, all the Live Pack features should be available.

If a Livegrade input is used before Live Pack is enabled on the license, OmniScope shows an on-screen warning that reads **LIVE-PACK LICENSE REQUIRED** / **UNLICENSED LIVEGRADE INPUT**.


# Features

This section covers OmniScope features that enhance your workflow beyond the core scopes and QC tools.

## Available Features

### [Secondary Window](/nobe-omniscope/features/secondary-window)

Display scopes across two monitors for expanded workspace and comprehensive signal analysis.

***

### [System Audio Capture](/nobe-omniscope/features/system-audio-capture)

Capture your computer's audio output directly — no cables required. Monitor loudness, stereo imaging, and phase from any application using OmniScope's Audio Meter and Goniometer scopes.

***

### [Crop](/nobe-omniscope/features/crop)

Isolate a specific region of the input frame for targeted scope and QC analysis. Especially useful for Screen Capture sources or focusing on a particular area of the image.

***

### [Snapshots](/nobe-omniscope/features/snapshots)

Freeze a frame from any live input and use it as a reference for color matching, QC review, and before/after comparisons. Supports split, wipe, blend, and side-by-side compare modes.

***

### [3D LUT & Color Management](/nobe-omniscope/features/3d-lut)

Apply 3D LUTs, 1D LUTs, ICC profiles, and OpenColorIO transforms to input sources for accurate color preview and analysis.

***

### [Overlays](/nobe-omniscope/features/overlays)

Display PNG images with alpha transparency on top of the Source Signal viewer — safe-area guides, framing references, branding, or composition grids.

***

### [Global Targets](/nobe-omniscope/features/global-targets)

Add reference lines to waveform and parade scopes at specific luma or RGB values. Save and recall target sets for different projects or standards.

***

### [Color Key](/nobe-omniscope/features/color-key)

Isolate a range of colors in the input signal using HSV or RGB mode. Pixels outside the selected range are displayed as black in the Source Signal viewer.

***

### [A/V Sync Measurement](/nobe-omniscope/features/av-sync-measurement)

Measure the timing difference between a video flash and an audio beep using matching source timestamps. The beta supports a selectable flash region, audio channel, thresholds, and clear early/late status.

***


# Secondary Window

Secondary Window lets you spread OmniScope scopes across two displays.

<figure><img src="https://565437294-files.gitbook.io/~/files/v0/b/gitbook-x-prod.appspot.com/o/spaces%2F-MFqn5MuayPgQPMZ9pwf%2Fuploads%2Fgit-blob-efbc7f855b072b64fdffdaa8331531a303e83ec1%2F2026-02_secondary_window.jpg?alt=media" alt=""><figcaption><p>OmniScope with a secondary window on a second display</p></figcaption></figure>

## Current Scope

The current implementation is focused on **macOS** and supports two native windows:

* Main Window
* Secondary Window

## Requirements

* Two connected displays
* Multi-monitor support enabled in Preferences
* App restart after enabling multi-monitor support

## Open and Close the Secondary Window

Use the macOS menu:

* **Window > Open Secondary Window**
* **Window > Close Secondary Window**

The app remembers the secondary window position and whether it was open.

## Assign Scopes to a Window

Use a scope tab menu (hamburger) and select:

* **Window > Main Window**
* **Window > Secondary Window**

When the secondary window is closed, scopes assigned to it are hidden. Reopening restores them.

## Move Snapshots and QC Timelines

In OmniScope 1.11.54 and later, use the **Snapshots** panel's three-dot menu or a QC timeline's context menu to select **Send to Secondary Window**. Sending a panel opens the secondary window if needed. Use **Send to Primary Window** to move it back.

When the secondary window is closed, assigned Snapshots and QC timeline panels appear temporarily in the main window. Their preferred placement is restored when the secondary window reopens.

## Adding New Scopes to the Secondary Window

To add new scopes directly in the secondary window, **right-click any empty space** in the window and select a scope from the **Scope** context menu.

<figure><img src="https://565437294-files.gitbook.io/~/files/v0/b/gitbook-x-prod.appspot.com/o/spaces%2F-MFqn5MuayPgQPMZ9pwf%2Fuploads%2Fgit-blob-fa9a5b7c7c46e43cab5f312a446233093e9dcca6%2F2026-03_secondary_add_scope_empty.png?alt=media" alt=""><figcaption><p>Right-click empty space to add a scope to the secondary window</p></figcaption></figure>

This works when the window is empty or when there is available space between or around existing scopes.

<figure><img src="https://565437294-files.gitbook.io/~/files/v0/b/gitbook-x-prod.appspot.com/o/spaces%2F-MFqn5MuayPgQPMZ9pwf%2Fuploads%2Fgit-blob-d11c3c4df17a11588c5bc3dc2104f0cf4724f7aa%2F2026-03_secondary_add_scope_with_scopes.png?alt=media" alt=""><figcaption><p>Adding a scope when other scopes are already present</p></figcaption></figure>

{% hint style="info" %}
If all scopes are docked to fill the entire window, there is no empty space to right-click. To add more scopes, first remove or resize an existing scope to create empty space, then right-click to add the new scope and dock it back into the layout.
{% endhint %}

## Layouts

Saved layouts include both windows, scope placement, and the window assigned to each Snapshots or QC timeline panel. If only one display is available, scopes are arranged on the active display.

## Full Screen

**View → Full Screen** (or the keyboard shortcut) toggles full screen on both the main and secondary windows simultaneously on macOS and Windows. Each window enters full screen on its own display.

On macOS, OmniScope remembers whether the secondary window was maximized or full screen across restarts. Switching between layouts that both use a full-screen secondary window keeps it full screen.

## Current Limitations

* No drag-and-drop of scope tabs between OS windows
* Two-window setup only

## Troubleshooting

### Secondary window opens on the wrong monitor

Move it manually once; the position is persisted.

### Secondary window opens with no scopes

Assign one or more scopes to **Secondary Window** from each scope menu.

### Menu item is missing

Enable multi-monitor support in Preferences and restart OmniScope.

## Related

* [Layouts](/nobe-omniscope/layouts)
* [Scopes Overview](/nobe-omniscope/scopes)


# System Audio Capture

{% hint style="info" %}
Requires **macOS 14.4** or later. Windows support uses WASAPI.
{% endhint %}

System Audio Capture lets OmniScope monitor your computer's audio output without any external cabling. Audio from any application — DAW, NLE, media player — is captured directly and fed into OmniScope's **Audio Meter** and **Goniometer** scopes for real-time analysis.

<figure><img src="https://565437294-files.gitbook.io/~/files/v0/b/gitbook-x-prod.appspot.com/o/spaces%2F-MFqn5MuayPgQPMZ9pwf%2Fuploads%2Fgit-blob-b5b6ed13aba8720b1767076097beb3511473c25c%2F2026-02_system_audio_capture.jpg?alt=media" alt=""><figcaption><p>System Audio Capture window</p></figcaption></figure>

## How It Works

OmniScope taps into the system's audio output device using platform-native APIs:

| Platform    | Technology                        | Minimum Version |
| ----------- | --------------------------------- | --------------- |
| **macOS**   | Core Audio Tap (ScreenCaptureKit) | macOS 14.4      |
| **Windows** | WASAPI loopback capture           | Windows 10      |

The captured audio is delivered as **32-bit float** samples at **48 kHz stereo** and routed to OmniScope's audio pipeline — the same path used by hardware audio sources.

## Opening System Audio Capture

Open the window from the **Options** menu or the toolbar:

**Options > System Audio Capture**

## Controls

| Control                  | Description                                                                                   |
| ------------------------ | --------------------------------------------------------------------------------------------- |
| **Start / Stop Capture** | Begin or end system audio capture. On macOS, the first start may trigger a permission prompt. |
| **Output Device**        | Select which audio output device to tap. Defaults to the system's current output device.      |

## Audio Meter & Statistics

While capturing, the window displays:

* **Audio meter** — real-time L/R peak meters with hold indicators and dB readout
* **Audio format** — sample rate and channel count
* **Statistics** — frames captured, buffer overruns, capture latency, and processing load

## macOS Permissions

On macOS 14.4+, system audio capture requires **Screen & System Audio Recording** permission. If permission has not been granted:

1. Click **Start Capture** — macOS will prompt you to allow access
2. If previously denied, click **Open System Settings** and enable OmniScope under **Privacy & Security > Screen & System Audio Recording**

## WAV Dump (Debug)

For diagnostic purposes, you can record captured audio to a WAV file:

1. Enter a file path in the **WAV Dump** section
2. Set the **Max Seconds** limit (1–120 seconds)
3. Click **Start WAV Dump** to begin recording

The output is a 32-bit float PCM WAV file.

## Use Cases

* **Audio QC without hardware routing** — monitor loudness, stereo imaging, and phase directly from your NLE or DAW output
* **Remote review sessions** — combine system audio capture with NDI output to stream both video scopes and audio analysis to a remote client
* **Quick A/V sync checks** — pair system audio with a video source to verify lip sync without dedicated audio I/O

## Related

* [Audio Meter](/nobe-omniscope/scopes/audio-meter)
* [Goniometer](/nobe-omniscope/scopes/goniometer)


# Crop

Crop lets you isolate a specific region of the input frame so that only that area is analyzed by scopes and QC tools. This is especially useful when monitoring a **Screen Capture** source where the application window occupies only part of the screen, or when you want to focus analysis on a particular section of the image.

<figure><img src="https://565437294-files.gitbook.io/~/files/v0/b/gitbook-x-prod.appspot.com/o/spaces%2F-MFqn5MuayPgQPMZ9pwf%2Fuploads%2Fgit-blob-e14cbe00580a1d18ce5ae3fae6198ff4c48b5d04%2F2026-02_crop.jpg?alt=media" alt=""><figcaption><p>Crop overlay with position, dimensions, and aspect ratio</p></figcaption></figure>

## Opening the Crop Window

There are several ways to open crop:

| Method           | Action                                           |
| ---------------- | ------------------------------------------------ |
| **Menu**         | **View > Crop…**                                 |
| **Keyboard**     | **⌥C** (macOS) / **Alt+C** (Windows)             |
| **Input strip**  | Click the **crop icon** on the input thumbnail   |
| **Context menu** | Right-click an input source and select **Crop…** |

When crop is active, the full-screen overlay shows the current frame with draggable crop handles.

## Using Crop

1. **Open** the crop window — the full source frame is displayed as an overlay
2. **Drag the edges or corners** to adjust the crop region
3. **Drag inside** the crop rectangle to reposition it
4. The overlay displays the **position** (X, Y), **dimensions** (W, H), and **aspect ratio** of the cropped area in real time
5. Click **Apply Crop** to confirm, or **Reset** to restore the full frame

## Keyboard Shortcuts

| macOS | Windows | Action                             |
| ----- | ------- | ---------------------------------- |
| ⌥C    | Alt+C   | Toggle crop window                 |
| ⌥R    | Alt+R   | Reset crop                         |
| ESC   | ESC     | Close crop window without applying |

## Per-Input Crop

Crop settings are saved **per input source**. Each connected input can have its own independent crop region. When switching between inputs or loading layouts, crop settings are restored automatically.

If you set an **input aspect ratio** (for example 1.85, 2.39, or 9:16), OmniScope keeps the full source image on the axis that still fits and adds blanking on the opposite axis as needed. It does not trim the source from the wrong sides just to satisfy the ratio.

You can toggle crop on or off for a specific input slot using the **Toggle crop** action in the [Action Editor](/nobe-omniscope/action-editor) or [StreamDeck](/nobe-omniscope/streamdeck/available-actions).

## Crop and Snapshots

By default, snapshots include the crop. From version **1.11.9+** you can choose to take snapshots **without** the crop applied — useful when you want to capture the full frame for reference while analyzing a cropped region.

## Common Use Cases

* **Screen Capture monitoring** — crop to the video player or NLE viewer area and ignore the rest of the screen
* **Letterbox / pillarbox removal** — crop out black bars to get accurate scope readings of the active picture only
* **Region-of-interest analysis** — focus waveform, vectorscope, and histogram analysis on a specific area of the frame (e.g. skin tones, sky, shadows)

## Related

* [Screen Capture](/nobe-omniscope/sources/screen-capture)
* [Keyboard Shortcuts](/nobe-omniscope/settings-and-preferences/keyboard-shortcuts)
* [Available Actions](/nobe-omniscope/streamdeck/available-actions)


# Snapshots

Snapshots let you freeze a frame from any live input and use it as a reference for comparison, analysis, or documentation. They are central to color matching, QC review, and before/after workflows.

<figure><img src="https://565437294-files.gitbook.io/~/files/v0/b/gitbook-x-prod.appspot.com/o/spaces%2F-MFqn5MuayPgQPMZ9pwf%2Fuploads%2Fgit-blob-1c56eec631750c1e2036e289ed24d4a88fb9b44a%2F2026-02_snapshots.jpg?alt=media" alt=""><figcaption><p>Snapshot panel with thumbnails and wipe comparison</p></figcaption></figure>

## Taking a Snapshot

| Method                         | Action                                                             |
| ------------------------------ | ------------------------------------------------------------------ |
| **Toolbar**                    | Click the **Take Snapshot** button                                 |
| **Keyboard**                   | **⌥H** (macOS) / **Alt+H** (Windows) — pause all scopes, then grab |
| **Keyboard**                   | **⌥B** (macOS) / **Alt+B** (Windows) — toggle snapshot display     |
| **Keyboard**                   | **⇧L** (macOS) / **⇧L** (Windows) — blend last snapshot            |
| **Context menu**               | Right-click an input source > **Grab Snapshot**                    |
| **StreamDeck / Action Editor** | Use the **Grab Snapshot** action                                   |

Snapshots are saved as image files to `~/Library/Application Support/NobeOmniScope/snapshots/` (macOS) or the equivalent `AppData` folder (Windows).

## Viewing Snapshots

### Snapshot Scope

The **Snapshot** scope behaves like a Source Signal viewer until a frame is captured. Once a snapshot is taken, it displays the frozen frame. You can assign a snapshot as the reference source for any other scope — waveform, vectorscope, histogram, etc. — for direct comparison.

See [Snapshot Scope](/nobe-omniscope/scopes/snapshot) for scope-specific settings.

### Snapshot Thumbnails

The snapshot panel shows thumbnails of all captured snapshots. You can:

* **Click** a thumbnail to load it as the active reference
* **Drag and drop** a snapshot onto any scope to assign it as that scope's source
* **Organize** snapshots into sub-folders
* **Sort** by newest or oldest
* **Resize** thumbnails using the thumbnail size control
* **Delete** individual snapshots or clear all snapshots in the current directory

To open the snapshots folder on disk, click the **folder icon** in the toolbar, or right-click any snapshot thumbnail and select **Reveal in Finder** (macOS) / **Reveal in Explorer** (Windows).

In OmniScope 1.11.54 and later, open the panel's three-dot menu and select **Send to Secondary Window** to move the Snapshots panel to the secondary display. Its placement is saved in layouts.

<figure><img src="https://565437294-files.gitbook.io/~/files/v0/b/gitbook-x-prod.appspot.com/o/spaces%2F-MFqn5MuayPgQPMZ9pwf%2Fuploads%2Fgit-blob-766de6ff2b3bb0c0a7b3f1ee83d9d8cf155ff6e2%2F2026-03_snapshots-folder.jpg?alt=media" alt=""><figcaption><p>Open the snapshots folder from the toolbar or by right-clicking a thumbnail</p></figcaption></figure>

## Compare Modes

### Split / Wipe

Overlay the snapshot and live signal side by side with a horizontal or vertical wipe. Drag the wipe position to compare different areas of the frame. Wipe overlays include tooltips for easier control.

<figure><img src="https://565437294-files.gitbook.io/~/files/v0/b/gitbook-x-prod.appspot.com/o/spaces%2F-MFqn5MuayPgQPMZ9pwf%2Fuploads%2Fgit-blob-df77fed2e462e2a14a91d4386e7e06d2f9707677%2F2026-02_snapshots_wipe.jpg?alt=media" alt=""><figcaption><p>Snapshot wipe comparison — drag the divider to reveal differences</p></figcaption></figure>

### Blend

Blend the snapshot transparently over the live signal using a configurable **alpha value**. Adjust blend strength by holding **W** and dragging the mouse in the viewer.

### Side by Side

View the snapshot and live signal next to each other in separate panels.

<figure><img src="https://565437294-files.gitbook.io/~/files/v0/b/gitbook-x-prod.appspot.com/o/spaces%2F-MFqn5MuayPgQPMZ9pwf%2Fuploads%2Fgit-blob-3b3c5767a7f85d1b886e7b56c3aef5bc7e43d544%2F2026-02_snapshots_sidebyside.jpg?alt=media" alt=""><figcaption><p>Side-by-side snapshot comparison</p></figcaption></figure>

## Snapshot Settings

<figure><img src="https://565437294-files.gitbook.io/~/files/v0/b/gitbook-x-prod.appspot.com/o/spaces%2F-MFqn5MuayPgQPMZ9pwf%2Fuploads%2Fgit-blob-aca3b6d7e56068b938ef1d1c293793944ea50e54%2F2026-02_snapshots_settings.jpg?alt=media" alt=""><figcaption><p>Snapshot settings</p></figcaption></figure>

{% hint style="info" %}
The Snapshot Settings panel is scrollable — all options are accessible even when the panel is resized to a small height. Action buttons (OK / Cancel) remain pinned at the bottom.
{% endhint %}

| Setting                              | Description                                                                                                                                                                                                                                                |
| ------------------------------------ | ---------------------------------------------------------------------------------------------------------------------------------------------------------------------------------------------------------------------------------------------------------- |
| **Snapshot Folder**                  | Choose a custom folder where snapshot files are saved. Use the folder picker button to browse, or type a path directly. Defaults to `~/Library/Application Support/NobeOmniScope/snapshots/` (macOS) / the equivalent `AppData` path (Windows). (1.11.30+) |
| **PNG Compression**                  | Set the compression level for saved PNG snapshots (0 = fastest/largest, 9 = slowest/smallest). Higher values reduce file size at the cost of write time. (1.11.30+)                                                                                        |
| **Apply input 3D LUT in split mode** | Apply the input's 3D LUT to the snapshot when comparing in split mode (1.11.17+)                                                                                                                                                                           |
| **Take snapshots without crop**      | Capture the full frame even when [crop](/nobe-omniscope/features/crop) is active (1.11.9+)                                                                                                                                                                 |
| **Blend alpha**                      | Set the default transparency for blend mode (1.11.13+)                                                                                                                                                                                                     |
| **Filename Template**                | Customize the file naming pattern for saved snapshots. Tokens are expanded at save time. Use `/` to create subfolders automatically. See [Filename Templates](#filename-templates) below. (1.11.34+)                                                       |

## Filename Templates

Control where and how snapshot files are named using a template string with token placeholders. The template is set in **Snapshot Settings** and applies to both manual and auto-snapshots (auto-snapshots can optionally use a separate template).

### Default template

```
snapshot_%DATE%_%TIME%_s%INPUT_SLOT%
```

This produces files like `snapshot_2026-03-15_143022_s0.jpg`.

### Available tokens

| Token             | Description                    | Example                             |
| ----------------- | ------------------------------ | ----------------------------------- |
| `%DATE%`          | Current date                   | `2026-03-15`                        |
| `%TIME%`          | Current time (no colons)       | `143022`                            |
| `%TIMESTAMP%`     | Date and time combined         | `2026-03-15_143022`                 |
| `%TIMESTAMP_MS%`  | Timestamp with milliseconds    | `2026-03-15-143022450`              |
| `%INPUT_SLOT%`    | Input slot index               | `0`, `1`, `window`                  |
| `%INPUT_NAME%`    | Input device name              | `LG Cymatic Jazz 4K Demo`           |
| `%TIMECODE%`      | Source timecode (if available) | `00_01_26_50`                       |
| `%FRAME%`         | Frame number                   | `5206`                              |
| `%RESOLUTION%`    | Frame resolution               | `3840x2160`                         |
| `%SNAPSHOT_KIND%` | Capture type                   | `manual`, `auto`, `window`          |
| `%SOURCE_TYPE%`   | Source category                | `file`, `signal_generator`, `scope` |

### Creating subfolders

Use `/` in the template to organize snapshots into subfolders. Folders are created automatically if they don't exist.

**Example — group by input name:**

```
%INPUT_NAME%/snapshot_%DATE%_%TIME%
```

Saves to: `snapshots/LG Cymatic Jazz 4K Demo/snapshot_2026-03-15_143022.jpg`

**Example — group by date with timecode:**

```
%DATE%/%INPUT_NAME%_tc%TIMECODE%_f%FRAME%
```

Saves to: `snapshots/2026-03-15/LG Cymatic Jazz 4K Demo_tc00_01_26_50_f5206.jpg`

### Editing in the UI

Click any token button in the Snapshot Settings panel to append it to the template, or drag and drop tokens into the text field. A live preview shows what the resolved filename will look like.

## Per-Input Snapshots

Each input slot maintains its own snapshot. When multiple sources are connected, you can grab and manage snapshots independently for each input. Snapshots are stored per-source and restored when switching between inputs or loading layouts.

## Grab Snapshots for All Inputs

Use the **Grab Snapshots for all inputs** action to capture a snapshot from every connected input simultaneously — useful for multi-camera workflows where you need a reference frame from each camera at the same moment.

## Window Snapshots

In addition to input snapshots, you can capture a **screenshot of the entire OmniScope window** — all scopes, overlays, and UI — using the **Grab Window Snapshot** action (**⌘B** on macOS / **Ctrl+B** on Windows).

## Auto-Snapshot

{% hint style="info" %}
Auto-Snapshot requires a **Live Pack** license.
{% endhint %}

Automatically capture snapshots at a configurable interval — from minutes down to milliseconds. This is useful for continuous signal monitoring, temporal comparison, or set documentation.

See [Auto-Snapshot](/nobe-omniscope/live-pack-add-on/auto-snapshot) for details.

## Snapshot as Source

{% hint style="info" %}
Snapshot as Source requires a **Live Pack** license.
{% endhint %}

Promote any snapshot to a live source for use in scope comparisons and overlays, enabling side-by-side evaluation of live signal vs. static references without switching applications.

See [Snapshot as Source](/nobe-omniscope/live-pack-add-on/snapshot-as-source) for details.

## Keyboard Shortcuts

| macOS | Windows | Action                  |
| ----- | ------- | ----------------------- |
| ⌥B    | Alt+B   | Toggle snapshot display |
| ⇧L    | ⇧L      | Blend last snapshot     |
| ⌘B    | Ctrl+B  | Grab window snapshot    |

## Related

* [Snapshot Scope](/nobe-omniscope/scopes/snapshot)
* [Auto-Snapshot](/nobe-omniscope/live-pack-add-on/auto-snapshot) (Live Pack)
* [Snapshot as Source](/nobe-omniscope/live-pack-add-on/snapshot-as-source) (Live Pack)
* [Keyboard Shortcuts](/nobe-omniscope/settings-and-preferences/keyboard-shortcuts)


# 3D LUT & Color Management

OmniScope supports applying color transforms to input sources using **3D LUTs**, **1D LUTs**, **ICC profiles**, and **OpenColorIO (OCIO)** configurations. This lets you preview graded images, match monitor profiles, or convert between color spaces — all without affecting the original signal.

> **A 3D LUT is a lookup table**, not a formula. It samples the RGB cube on a regular grid (commonly 17³, 33³, or 65³ points) and stores the transformed output at each vertex. At runtime, the input color is located inside the cube and interpolated from its eight surrounding vertices using either **trilinear** (fast, cheaper, slightly less accurate) or **tetrahedral** (higher quality, especially for saturated colors) interpolation. A 1D LUT only transforms one channel at a time and cannot do chromaticity changes — it is used for tone shaping (gamma / EOTF conversion) but cannot implement a full camera-to-display color transform. Use 1D LUTs for transfer-function changes, 3D LUTs for gamut-and-transfer changes together.

<figure><img src="https://565437294-files.gitbook.io/~/files/v0/b/gitbook-x-prod.appspot.com/o/spaces%2F-MFqn5MuayPgQPMZ9pwf%2Fuploads%2Fgit-blob-6f450983848dfe413532c758c9951cda066fc8bf%2F2026-02_luts.jpg?alt=media" alt=""><figcaption><p>3D LUT browser window</p></figcaption></figure>

## Input 3D LUT

Each input source can have its own 3D LUT applied before the signal reaches the scopes. This is useful for monitoring how the image will look after a grade, or for converting log/RAW signals to a display color space.

### Applying a LUT

Loading a LUT and applying it are two separate steps:

1. **Add the LUT to the library** — open **Options > 1D/3D Luts**, click **Load LUT file...** and pick your `.cube`. The file is copied into OmniScope's LUT folder, so you only do this once.
2. **Apply it to a source** — click the **gear icon** on the input's tab in the input strip to open **Input Settings**, go to the **LUT & processing** section, tick **Input LUT**, then choose the file from the **Input Lut** dropdown that appears below it.

The LUT is applied per input slot, so each connected source can use a different transform.

<figure><img src="https://565437294-files.gitbook.io/~/files/v0/b/gitbook-x-prod.appspot.com/o/spaces%2F-MFqn5MuayPgQPMZ9pwf%2Fuploads%2Fgit-blob-e38d017b0ad8a4cf0770efd400026ea4c42c7621%2F2026-02_lut_input_settings.jpg?alt=media" alt=""><figcaption><p>Input 3D LUT enabled in the input settings</p></figcaption></figure>

### Supported Formats

OmniScope reads the Iridas `.cube` format only.

| Format | Extension | Notes                                     |
| ------ | --------- | ----------------------------------------- |
| 3D LUT | `.cube`   | Files declaring `LUT_3D_SIZE`             |
| 1D LUT | `.cube`   | Files declaring `LUT_1D_SIZE` (1.10.139+) |

Other container formats — `.3dl`, `.csp`, `.spi1d` — are not supported. Convert them to `.cube` first (DaVinci Resolve, Lattice, or `ociobakelut` will all do this).

### LUT Options

| Option                                                | Where                  | Description                                                                                             |
| ----------------------------------------------------- | ---------------------- | ------------------------------------------------------------------------------------------------------- |
| **Tetrahedral interpolation**                         | Options > 1D/3D Luts   | Higher-quality LUT interpolation (more accurate but slightly slower). Requires an application restart.  |
| **Apply Input Settings**                              | Output device settings | Include the input settings — 3D LUT, aspect ratio, color-space transform — in the NDI/SDI output signal |
| **Apply input 3D Lut to the snapshot when comparing** | Snapshots window       | Apply the LUT when comparing snapshots in split mode                                                    |

## ICC Profiles

ICC profiles can be loaded to compensate for monitor color characteristics. OmniScope can also read the system's display ICC profile on macOS.

| Setting                 | Description                                                      |
| ----------------------- | ---------------------------------------------------------------- |
| **Display ICC profile** | Use the monitor's ICC profile for accurate color display (macOS) |
| **Custom ICC profile**  | Load a specific ICC profile file                                 |

## OpenColorIO (OCIO)

{% hint style="info" %}
OCIO support requires a **Pro** license.
{% endhint %}

OmniScope integrates with **OpenColorIO 2.5.1** for professional color pipeline management. Load a custom OCIO configuration to access all color spaces defined in your pipeline.

* Set the OCIO config path in **Preferences / OpenColorIO**
* Select input and display color spaces from the OCIO configuration
* Color space primaries from the active OCIO config are shown in the **CIE Plot**

### Bundled ACES Config

OmniScope ships with a bundled ACES configuration that does not require any external OCIO setup. In **Preferences / OpenColorIO**, select the ACES version that matches your project:

| Version               | Description                            |
| --------------------- | -------------------------------------- |
| **ACES 1.3**          | Standard ACES 1.3 transforms           |
| **ACES 2.0 (compat)** | ACES 2.0 with compatibility transforms |

Use the bundled config for ACES monitoring in DaVinci Resolve or other hosts — see [ACES Monitoring (DaVinci Resolve OFX)](/nobe-omniscope/sources/davinci-resolve-ofx/color-managed-timeline#aces-monitoring) for the full setup guide.

### ACES in a nutshell

The **Academy Color Encoding System** is a scene-referred, camera-agnostic color pipeline standardized by the Academy of Motion Picture Arts and Sciences. Every ACES transform slots into one of four stages:

| Stage                                   | What it does                                                                                                                                  | Where                                 |
| --------------------------------------- | --------------------------------------------------------------------------------------------------------------------------------------------- | ------------------------------------- |
| **IDT** — Input Device Transform        | Converts a specific camera's native color space (ARRI Log C, Sony S-Log3/S-Gamut3, RED IPP2, etc.) to scene-linear ACES2065-1 (AP0 primaries) | Per-source / per-clip                 |
| **LMT** — Look Modification Transform   | Optional creative "look" applied in ACES space, before the output transform. Examples: film emulation, print-emulation LUT, directorial look  | Per-sequence / global                 |
| **RRT** — Reference Rendering Transform | Fixed, canonical tone and gamut rendering from scene-linear to an intermediate display-referred space (OCES)                                  | Global (part of the Output Transform) |
| **ODT** — Output Device Transform       | Maps the RRT output to a specific display — Rec. 709 sRGB, Rec. 2020 PQ 1 000 nits, P3-D65 2 000 nits, DCI-P3, etc.                           | Per-output                            |

Working in ACES has two big advantages for scope analysis: (1) every camera looks like every other camera in the working space, so exposure and white-balance calls are apples-to-apples, and (2) the IDT — not the LUT chain — handles the camera conversion, so decisions about "what should this neutral gray be at" are stable across clips. The trade-off is that you must apply the matching ODT before looking at the picture on a display-referred monitor. OmniScope's OCIO support puts the ODT selection in your hands.

## 3D LUT / ICC Scope

The dedicated [3D LUT / ICC scope](/nobe-omniscope/scopes/3d-lut-icc-profile) shows the effect of the color transform in a separate viewer, letting you compare the original and transformed image.

## Keyboard Shortcuts

| macOS | Windows | Action                             |
| ----- | ------- | ---------------------------------- |
| ⌥D    | Alt+D   | Toggle input 3D LUT on all sources |

{% hint style="info" %}
The toggle only acts on sources that already have a LUT selected in the **Input Lut** dropdown — if no LUT has been chosen yet there is nothing to switch on, and the shortcut appears to do nothing.
{% endhint %}

A per-source **Toggle input 3D LUT** action is also available, and can be bound to a key under **Options > Keyboard actions** or to a Stream Deck button.

## Related

* [3D LUT / ICC Scope](/nobe-omniscope/scopes/3d-lut-icc-profile)
* [False Color](/nobe-omniscope/scopes/false-color) — can export a 3D LUT
* [Available Actions](/nobe-omniscope/streamdeck/available-actions)


---

[Next Page](/llms-full.txt/1)